Seagate 2004 Annual Report Download - page 30
Download and view the complete annual report
Please find page 30 of the 2004 Seagate annual report below. You can navigate through the pages in the report by either clicking on the pages listed below, or by using the keyword search tool below to find specific information within the annual report.-
 1
1 -
2
-
3
-
4
-
5
-
6
-
7
-
8
-
9
-
10
-
11
-
12
-
13
-
14
-
15
-
16
-
17
-
18
-
19
-
 20
20 -
 21
21 -
 22
22 -
 23
23 -
 24
24 -
 25
25 -
 26
26 -
 27
27 -
 28
28 -
 29
29 -
 30
30 -
 31
31 -
 32
32 -
 33
33 -
 34
34 -
 35
35 -
 36
36 -
 37
37 -
 38
38 -
 39
39 -
 40
40 -
41
-
42
-
43
-
44
-
45
-
46
-
47
-
48
-
49
-
50
-
51
-
52
-
53
-
54
-
55
-
56
-
57
-
58
-
59
-
60
-
61
-
62
-
63
-
64
-
65
-
66
-
67
-
68
-
69
-
70
-
71
-
72
-
73
-
74
-
75
-
76
-
77
-
78
-
79
-
80
-
81
-
82
-
83
-
84
-
85
-
86
-
87
-
88
-
89
-
90
-
91
-
92
-
93
-
94
-
95
-
96
-
97
-
98
-
99
-
100
-
101
-
102
-
103
-
104
-
105
-
106
-
107
-
108
-
109
-
110
-
111
-
112
-
113
-
114
-
115
-
116
-
117
-
118
-
119
-
120
-
121
-
122
-
123
-
124
 |
 |

Table of Contents
Results of Operations
We list in the tables below the historical consolidated statements of operations in dollars and as a percentage of revenue for the fiscal
years indicated.
Fiscal Year 2005 Compared to Fiscal Year 2004
Fiscal Year Ended
July 1,
2005
July 2,
2004
June 27,
2003
(in millions)
Revenue
$
7,553
$
6,224
$
6,486
Cost of revenue
5,880
4,765
4,759
Gross margin
1,673
1,459
1,727
Product development
645
666
670
Marketing and administrative
306
290
357
Restructuring
—
59
9
Income from operations
722
444
691
Other income (expense), net
10
(16
)
(31
)
Income before income taxes
732
428
660
Provision for (benefit from) income taxes
25
(101
)
19
Net income
$
707
$
529
$
641
Fiscal Year Ended
July 1,
2005
July 2,
2004
June 27,
2003
Revenue
100
%
100
%
100
%
Cost of revenue
78
77
73
Gross margin
22
23
27
Product development
9
11
10
Marketing and administrative
4
5
6
Restructuring
—
—
—
Income from operations
9
7
11
Other income (expense), net
—
—
(
1
)
Income before income taxes
9
7
10
Provision for (benefit from) income taxes
—
(
2
)
—
Net income
9
%
9
%
10
%
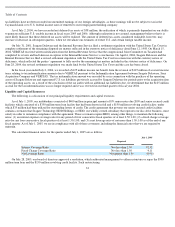
Revenue.
Revenue for fiscal year 2005 was $7.553 billion, up 21% from $6.224 billion in fiscal year 2004. The increase in revenue was
primarily due to record disc drive shipments of 98.1 million units in fiscal year 2005 compared to 79.3 million units in fiscal year 2004, as well
as an improved product mix of our new products, offset by price erosion. Unit shipments for our products in fiscal year 2005 were as follows:
•
Consumer —16.7 million, up from 6.3 million units in fiscal year 2004.
•
Mobile
— 5.7 million, up from 3.6 million units in fiscal year 2004.
•
Enterprise
—13.5 million, up from 10.4 million units in fiscal year 2004.
Our overall average sales price per unit (ASP) for our products was $72, $76, $79 and $80 for the first, second, third and fourth quarters
of fiscal year 2005, respectively. This increase in overall ASP reflects the favorable impact of the new products, many of which have ASP’s
above the company average.
•
Desktop
—62.2 million, up from 59.0 million units in fiscal year 2004.