Neiman Marcus 2006 Annual Report Download - page 37
Download and view the complete annual report
Please find page 37 of the 2006 Neiman Marcus annual report below. You can navigate through the pages in the report by either clicking on the pages listed below, or by using the keyword search tool below to find specific information within the annual report.-
 1
1 -
2
-
3
-
4
-
5
-
6
-
7
-
8
-
9
-
10
-
11
-
12
-
13
-
14
-
15
-
16
-
17
-
18
-
19
-
20
-
21
-
22
-
23
-
24
-
25
-
26
-
 27
27 -
 28
28 -
 29
29 -
 30
30 -
 31
31 -
 32
32 -
 33
33 -
 34
34 -
 35
35 -
 36
36 -
 37
37 -
 38
38 -
 39
39 -
 40
40 -
 41
41 -
 42
42 -
 43
43 -
 44
44 -
 45
45 -
 46
46 -
 47
47 -
48
-
49
-
50
-
51
-
52
-
53
-
54
-
55
-
56
-
57
-
58
-
59
-
60
-
61
-
62
-
63
-
64
-
65
-
66
-
67
-
68
-
69
-
70
-
71
-
72
-
73
-
74
-
75
-
76
-
77
-
78
-
79
-
80
-
81
-
82
-
83
-
84
-
85
-
86
-
87
-
88
-
89
-
90
-
91
-
92
-
93
-
94
-
95
-
96
-
97
-
98
-
99
-
100
-
101
-
102
-
103
-
104
-
105
-
106
-
107
-
108
-
109
-
110
-
111
-
112
-
113
-
114
-
115
-
116
-
117
-
118
-
119
-
120
-
121
-
122
-
123
-
124
-
125
-
126
-
127
-
128
-
129
-
130
-
131
-
132
-
133
-
134
-
135
-
136
-
137
-
138
-
139
-
140
-
141
-
142
-
143
-
144
-
145
-
146
-
147
-
148
-
149
-
150
-
151
-
152
-
153
-
154
-
155
-
156
-
157
-
158
-
159
-
160
-
161
-
162
-
163
-
164
-
165
-
166
-
167
-
168
-
169
-
170
-
171
 |
 |

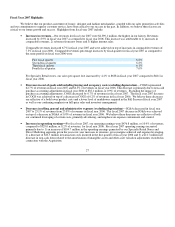
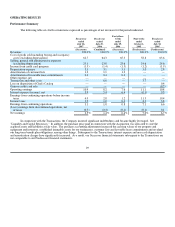
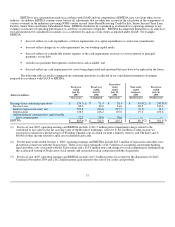
Fiscal Year Ended July 29, 2006 Compared to Fiscal Year Ended July 30, 2005
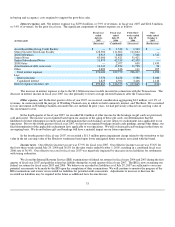
Revenues. Revenues for fiscal year 2006 of $4,030.1 million increased $335.0 million, or 9.1%, from $3,695.1 million in fiscal
year 2005, reflecting increases in comparable revenues, revenues from new stores and higher internet sales. Revenues increased in fiscal
year 2006 compared to fiscal year 2005 at all our operating companies.
Comparable revenues for fiscal year 2006 were $3,922.9 million compared to $3,671.7 million in fiscal year 2005, representing
an increase of 7.3%. Comparable revenues increased in fiscal year 2006 by 6.1% for Specialty Retail stores and 13.3% for Direct
Marketing compared to fiscal year 2005.
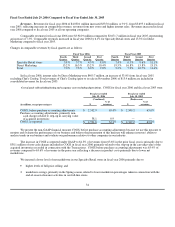
Changes in comparable revenues by fiscal quarter are as follows:
Fiscal Year 2006 Fiscal Year 2005
Fourth
Quarter
Third
Quarter
Second
Quarter
First
Quarter
Fourth
Quarter
Third
Quarter
Second
Quarter
First
Quarter
Specialty Retail stores 5.8% 5.7% 4.5% 8.8% 7.4% 6.5% 9.6% 11.1%
Direct Marketing 13.2% 16.5% 13.2% 10.4% 19.5% 16.8% 15.8% 13.1%
Total 7.0% 7.3% 6.0% 9.0% 9.2% 7.9% 10.7% 11.4%
In fiscal year 2006, internet sales by Direct Marketing were $405.7 million, an increase of 33.0% from fiscal year 2005,
excluding Chef's Catalog. Total revenues of Chef's Catalog (prior to its sale in November 2004) of $13.9 million are included in
consolidated revenues for fiscal year 2005.
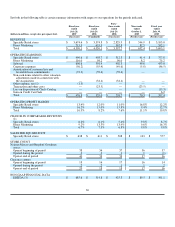
Cost of goods sold including buying and occupancy costs (excluding depreciation). COGS for fiscal year 2006 and fiscal year 2005 were:
Fiscal year ended
July 29, 2006
Fiscal year ended
July 30, 2005
(Combined) (Predecessor)
(in millions, except percentages) $
% of
revenues $
% of
revenues
COGS, before purchase accounting adjustments $ 2,552.9 63.4% $ 2,349.2 63.6%
Purchase accounting adjustments, primarily non-
cash charges related to step-up in carrying value
of acquired inventories 38.1 0.9 — —
COGS, as reported $ 2,591.0 64.3%$ 2,349.2 63.6%
We present the non-GAAP financial measure COGS, before purchase accounting adjustments because we use this measure to
monitor and evaluate the performance of our business and believe the presentation of this measure will enhance investors' ability to
analyze trends in our business and evaluate our performance relative to other companies in our industry.
The increase in COGS as reported under GAAP to 64.3% of revenues from 63.6% in the prior fiscal year is primarily due to
$38.1 million of non-cash charges included in COGS in fiscal year 2006 primarily related to the step-up in the carrying value of the
acquired inventories recorded in connection with the Transactions. COGS before purchase accounting adjustments was 63.4% of
revenues compared to 63.6% of revenues in the prior year reflecting a decrease in product costs primarily due to lower net
markdowns.
We incurred a lower level of net markdowns in our Specialty Retail stores in fiscal year 2006 primarily due to:
• higher levels of full-price selling; and
• markdown savings, primarily in the Spring season, related to lower markdown percentages taken in connection with the
end-of-season clearance activities in our full-line stores.
34