Neiman Marcus 2006 Annual Report Download - page 154
Download and view the complete annual report
Please find page 154 of the 2006 Neiman Marcus annual report below. You can navigate through the pages in the report by either clicking on the pages listed below, or by using the keyword search tool below to find specific information within the annual report.-
 1
1 -
2
-
3
-
4
-
5
-
6
-
7
-
8
-
9
-
10
-
11
-
12
-
13
-
14
-
15
-
16
-
17
-
18
-
19
-
20
-
21
-
22
-
23
-
24
-
25
-
26
-
27
-
28
-
29
-
30
-
31
-
32
-
33
-
34
-
35
-
36
-
37
-
38
-
39
-
40
-
41
-
42
-
43
-
44
-
45
-
46
-
47
-
48
-
49
-
50
-
51
-
52
-
53
-
54
-
55
-
56
-
57
-
58
-
59
-
60
-
61
-
62
-
63
-
64
-
65
-
66
-
67
-
68
-
69
-
70
-
71
-
72
-
73
-
74
-
75
-
76
-
77
-
78
-
79
-
80
-
81
-
82
-
83
-
84
-
85
-
86
-
87
-
88
-
89
-
90
-
91
-
92
-
93
-
94
-
95
-
96
-
97
-
98
-
99
-
100
-
101
-
102
-
103
-
104
-
105
-
106
-
107
-
108
-
109
-
110
-
111
-
112
-
113
-
114
-
115
-
116
-
117
-
118
-
119
-
120
-
121
-
122
-
123
-
124
-
125
-
126
-
127
-
128
-
129
-
130
-
131
-
132
-
133
-
134
-
135
-
136
-
137
-
138
-
139
-
140
-
141
-
142
-
143
-
 144
144 -
 145
145 -
 146
146 -
 147
147 -
 148
148 -
 149
149 -
 150
150 -
 151
151 -
 152
152 -
 153
153 -
 154
154 -
 155
155 -
 156
156 -
 157
157 -
 158
158 -
 159
159 -
 160
160 -
 161
161 -
 162
162 -
 163
163 -
 164
164 -
165
-
166
-
167
-
168
-
169
-
170
-
171
 |
 |

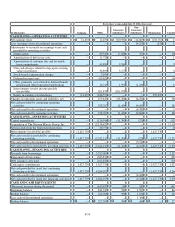
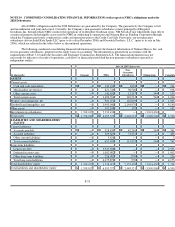
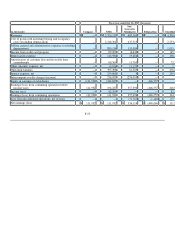
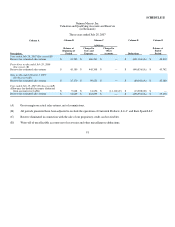
July 29, 2006 (Successor)
(in thousands) Company NMG
Non-
Guarantor
Subsidiaries Eliminations Consolidated
ASSETS
Current assets:
Cash and cash equivalents $ — $ 222,308 $ 1,432 $ — $ 223,740
Merchandise inventories — 711,443 84,259 (2,081 ) 793,621
Other current assets — 89,359 11,975 544 101,878
Current assets of discontinued operations — — 16,617 — 16,617
Total current assets — 1,023,110 114,283 (1,537 )1,135,856
Property and equipment, net — 875,725 154,554 — 1,030,279
Goodwill and intangibles, net — 2,007,770 2,215,987 — 4,223,757
Other assets — 124,929 394 — 125,323
Investments in subsidiaries 1,427,667 2,429,916 — (3,857,583 )
Non-current assets of discontinued operations — — 92,746 — 92,746
Total assets $ 1,427,667 $ 6,461,450 $ 2,577,964 $ (3,859,120 )$ 6,607,961
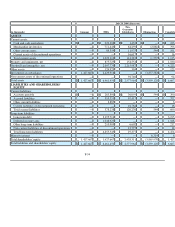
LIABILITIES AND SHAREHOLDERS'
EQUITY
Current liabilities:
Accounts payable $ — $ 263,800 $ 36,095 $ 544 $ 300,439
Accrued liabilities — 310,551 67,417 — 377,968
Other current liabilities — 3,887 — — 3,887
Current liabilities of discontinued operations — — 16,764 — 16,764
Total current liabilities — 578,238 120,276 544 699,058
Long-term liabilities:
Long-term debt — 3,195,711 — — 3,195,711
Deferred income taxes — 1,048,925 — — 1,048,925
Other long-term liabilities — 210,909 6,602 — 217,511
Non-current liabilities of discontinued operations — — 12,775 — 12,775
Total long-term liabilities — 4,455,545 19,377 — 4,474,922
Minority interest — — — 6,314 6,314
Total shareholders' equity 1,427,667 1,427,667 2,438,311 (3,865,978 )1,427,667
Total liabilities and shareholders' equity $ 1,427,667 $ 6,461,450 $ 2,577,964 $ (3,859,120 )$ 6,607,961
F-54