Neiman Marcus 2006 Annual Report Download - page 35
Download and view the complete annual report
Please find page 35 of the 2006 Neiman Marcus annual report below. You can navigate through the pages in the report by either clicking on the pages listed below, or by using the keyword search tool below to find specific information within the annual report.-
 1
1 -
2
-
3
-
4
-
5
-
6
-
7
-
8
-
9
-
10
-
11
-
12
-
13
-
14
-
15
-
16
-
17
-
18
-
19
-
20
-
21
-
22
-
23
-
24
-
 25
25 -
 26
26 -
 27
27 -
 28
28 -
 29
29 -
 30
30 -
 31
31 -
 32
32 -
 33
33 -
 34
34 -
 35
35 -
 36
36 -
 37
37 -
 38
38 -
 39
39 -
 40
40 -
 41
41 -
 42
42 -
 43
43 -
 44
44 -
 45
45 -
46
-
47
-
48
-
49
-
50
-
51
-
52
-
53
-
54
-
55
-
56
-
57
-
58
-
59
-
60
-
61
-
62
-
63
-
64
-
65
-
66
-
67
-
68
-
69
-
70
-
71
-
72
-
73
-
74
-
75
-
76
-
77
-
78
-
79
-
80
-
81
-
82
-
83
-
84
-
85
-
86
-
87
-
88
-
89
-
90
-
91
-
92
-
93
-
94
-
95
-
96
-
97
-
98
-
99
-
100
-
101
-
102
-
103
-
104
-
105
-
106
-
107
-
108
-
109
-
110
-
111
-
112
-
113
-
114
-
115
-
116
-
117
-
118
-
119
-
120
-
121
-
122
-
123
-
124
-
125
-
126
-
127
-
128
-
129
-
130
-
131
-
132
-
133
-
134
-
135
-
136
-
137
-
138
-
139
-
140
-
141
-
142
-
143
-
144
-
145
-
146
-
147
-
148
-
149
-
150
-
151
-
152
-
153
-
154
-
155
-
156
-
157
-
158
-
159
-
160
-
161
-
162
-
163
-
164
-
165
-
166
-
167
-
168
-
169
-
170
-
171
 |
 |

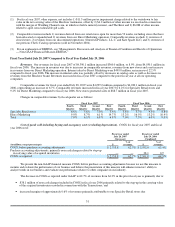
primarily to lower product costs, a decrease in net markdowns incurred in the Fall Season and a higher level of full-price sales
in fiscal year 2007.
Consistent with industry business practice, we receive allowances from certain of our vendors in support of the merchandise
we purchase for resale. We receive certain allowances to reimburse us for markdowns taken and/or to support the gross margins
realized in connection with the sales of the vendor's merchandise. We recognize these allowances as a decrease in COGS when the
allowances are earned and approved by the vendor. Other allowances we receive represent reductions to the amounts paid to acquire
the merchandise. We recognize these allowances as a reduction in the cost of the acquired merchandise resulting in a decrease in
COGS at the time the goods are sold. We received vendor allowances of $103.4 million, or 2.4% of revenues, in fiscal year 2007 and
$94.5 million, or 2.3% of revenues, in fiscal year 2006.
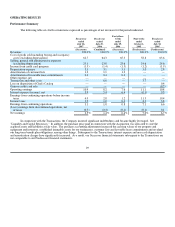
Selling, general and administrative expenses (excluding depreciation). SG&A expenses were 23.1% of revenues in fiscal
year 2007 compared to 23.8% of revenues in the prior fiscal year.
The net decrease in SG&A expenses as a percentage of revenues in fiscal year 2007 was primarily due to:
• a decrease in marketing and advertising costs of approximately 0.4% of revenues primarily due to 1) higher internet sales
by our Direct Marketing segment, which have a lower expense to revenue ratio than catalog sales and 2) a decrease in costs
incurred by our Specialty Retail stores;
• a decrease of approximately 0.4% of revenues in our payroll and employee benefit costs, primarily due to the leveraging of
these expenses on a higher level of revenues in fiscal year 2007 and favorable insurance claims experience; and
• a decrease in preopening expenses of approximately 0.1% of revenues.
These decreases in SG&A expenses, as a percentage of revenues, were partially offset by an increase in estimated annual
incentive compensation costs in fiscal year 2007 of approximately 0.2% of revenues.
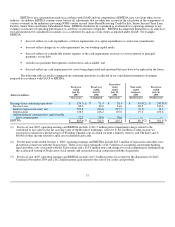
Income from credit card program. We received HSBC Program Income of $65.7 million, or 1.5% of revenues, in fiscal year
2007 compared to $57.2 million, or 1.4% of revenues, in fiscal year 2006. HSBC Program Income increased as a percentage of revenues
in fiscal year 2007 compared to the prior fiscal year as a result of changes made to our credit card program in fiscal year 2006 related to,
among other things, the interest rates applied to unpaid balances and the assessment of late fees.
Depreciation expense. Depreciation expense was $136.5 million, or 3.1% of revenues, in fiscal year 2007 compared to
$126.2 million, or 3.1% of revenues, in the prior fiscal year. The increase in depreciation expense was primarily due to new store
construction, store renovations and other capital spending in recent years.
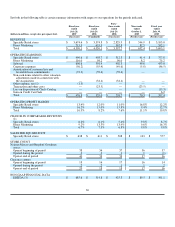
Amortization expense. Amortization of acquisition related intangibles (customer lists and favorable lease commitments)
recorded as a result of the application of purchase accounting in connection with the Acquisition aggregated $72.3 million, or 1.6% of
revenues, for fiscal year 2007 and $59.6 million, or 1.5% of revenues, for fiscal year 2006. The increase in amortization expense in
fiscal year 2007 is due primarily to the fact that the Successor period in which amortization expense was recorded in fiscal year 2006
consisted of only forty-three weeks.
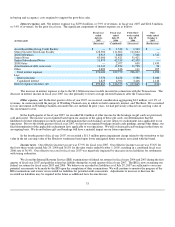
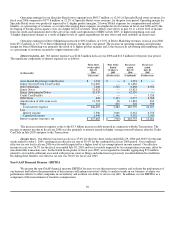
Segment operating earnings. Segment operating earnings for our Specialty Retail stores and Direct Marketing segments do
not reflect the impact of adjustments to revalue our assets and liabilities to estimated fair value at the Acquisition date. See Note 17 to
our consolidated financial statements.
Operating earnings for our Specialty Retail stores segment were $490.6 million, or 13.4% of Specialty Retail stores revenues,
for fiscal year 2007 compared to $403.7 million, or 12.0% of Specialty Retail stores revenues, for the prior fiscal year. The increase in
operating margin as a percentage of revenues was primarily due to 1) increased product margins due primarily to both lower product
costs and lower markdowns and a higher portion of full-price sales and 2) net reductions in expenses as a percentage of revenues,
primarily marketing and advertising, insurance, benefits and pre-opening expenses partially offset by higher incentive compensation.
Operating earnings for Direct Marketing increased to $116.0 million, or 16.2% of Direct Marketing revenues, in fiscal year
2007 from $98.2 million, or 15.0% of Direct Marketing revenues, for the prior fiscal year. The increases in operating earnings and
operating margin for Direct Marketing were primarily the result of 1) a decrease in advertising and marketing costs, as a percentage of
revenues, due to the continued growth in internet sales, partially offset by 2) an increase
32