Neiman Marcus 2006 Annual Report Download - page 107
Download and view the complete annual report
Please find page 107 of the 2006 Neiman Marcus annual report below. You can navigate through the pages in the report by either clicking on the pages listed below, or by using the keyword search tool below to find specific information within the annual report.-
 1
1 -
2
-
3
-
4
-
5
-
6
-
7
-
8
-
9
-
10
-
11
-
12
-
13
-
14
-
15
-
16
-
17
-
18
-
19
-
20
-
21
-
22
-
23
-
24
-
25
-
26
-
27
-
28
-
29
-
30
-
31
-
32
-
33
-
34
-
35
-
36
-
37
-
38
-
39
-
40
-
41
-
42
-
43
-
44
-
45
-
46
-
47
-
48
-
49
-
50
-
51
-
52
-
53
-
54
-
55
-
56
-
57
-
58
-
59
-
60
-
61
-
62
-
63
-
64
-
65
-
66
-
67
-
68
-
69
-
70
-
71
-
72
-
73
-
74
-
75
-
76
-
77
-
78
-
79
-
80
-
81
-
82
-
83
-
84
-
85
-
86
-
87
-
88
-
89
-
90
-
91
-
92
-
93
-
94
-
95
-
96
-
 97
97 -
 98
98 -
 99
99 -
 100
100 -
 101
101 -
 102
102 -
 103
103 -
 104
104 -
 105
105 -
 106
106 -
 107
107 -
 108
108 -
 109
109 -
 110
110 -
 111
111 -
 112
112 -
 113
113 -
 114
114 -
 115
115 -
 116
116 -
 117
117 -
118
-
119
-
120
-
121
-
122
-
123
-
124
-
125
-
126
-
127
-
128
-
129
-
130
-
131
-
132
-
133
-
134
-
135
-
136
-
137
-
138
-
139
-
140
-
141
-
142
-
143
-
144
-
145
-
146
-
147
-
148
-
149
-
150
-
151
-
152
-
153
-
154
-
155
-
156
-
157
-
158
-
159
-
160
-
161
-
162
-
163
-
164
-
165
-
166
-
167
-
168
-
169
-
170
-
171
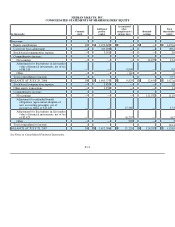
 |
 |

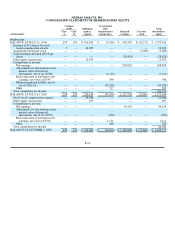
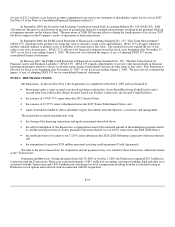
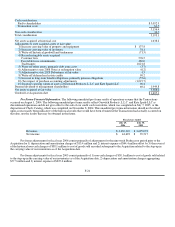
NEIMAN MARCUS, INC.
CONSOLIDATED STATEMENTS OF SHAREHOLDERS' EQUITY
(in thousands)
Common
stock
Additional
paid-in
capital
Accumulated
other
comprehensive
income (loss)
Retained
earnings
Total
shareholders'
equity
Successor:
Equity contributions 10 $ 1,470,622 $ — $ — $ 1,470,632
Carryover basis adjustment — (69,200 ) — — (69,200
Stock based compensation expense — 3,951 — — 3,951
Comprehensive income:
Net earnings — — — 12,455 12,455
Adjustments for fluctuations in fair market
value of financial instruments, net of tax
of $6,510 — — 9,990 — 9,990
Other — — (161 ) — (161
Total comprehensive income 22,284
BALANCE AT JULY 29, 2006 10 $ 1,405,373 $ 9,829 $ 12,455 $ 1,427,667
Stock based compensation expense — 5,859 — — 5,859
Other equity transactions — 1,154 — — 1,154
Comprehensive income:
Net earnings — — — 111,932 111,932
Adjustment for unfunded benefit
obligations (upon initial adoption of
new accounting principle), net of
income tax effect of $11,289 — — 17,365 — 17,365
Adjustments for fluctuations in fair market
value of financial instruments, net of tax
of $2,425 — — (6,257 ) — (6,257
Other — — 292 — 292
Total comprehensive income 123,332
BALANCE AT JULY 28, 2007 10 $ 1,412,386 $ 21,229 $ 124,387 $ 1,558,012
See Notes to Consolidated Financial Statements.
F-11