Neiman Marcus 2006 Annual Report Download - page 34
Download and view the complete annual report
Please find page 34 of the 2006 Neiman Marcus annual report below. You can navigate through the pages in the report by either clicking on the pages listed below, or by using the keyword search tool below to find specific information within the annual report.-
 1
1 -
2
-
3
-
4
-
5
-
6
-
7
-
8
-
9
-
10
-
11
-
12
-
13
-
14
-
15
-
16
-
17
-
18
-
19
-
20
-
21
-
22
-
23
-
 24
24 -
 25
25 -
 26
26 -
 27
27 -
 28
28 -
 29
29 -
 30
30 -
 31
31 -
 32
32 -
 33
33 -
 34
34 -
 35
35 -
 36
36 -
 37
37 -
 38
38 -
 39
39 -
 40
40 -
 41
41 -
 42
42 -
 43
43 -
 44
44 -
45
-
46
-
47
-
48
-
49
-
50
-
51
-
52
-
53
-
54
-
55
-
56
-
57
-
58
-
59
-
60
-
61
-
62
-
63
-
64
-
65
-
66
-
67
-
68
-
69
-
70
-
71
-
72
-
73
-
74
-
75
-
76
-
77
-
78
-
79
-
80
-
81
-
82
-
83
-
84
-
85
-
86
-
87
-
88
-
89
-
90
-
91
-
92
-
93
-
94
-
95
-
96
-
97
-
98
-
99
-
100
-
101
-
102
-
103
-
104
-
105
-
106
-
107
-
108
-
109
-
110
-
111
-
112
-
113
-
114
-
115
-
116
-
117
-
118
-
119
-
120
-
121
-
122
-
123
-
124
-
125
-
126
-
127
-
128
-
129
-
130
-
131
-
132
-
133
-
134
-
135
-
136
-
137
-
138
-
139
-
140
-
141
-
142
-
143
-
144
-
145
-
146
-
147
-
148
-
149
-
150
-
151
-
152
-
153
-
154
-
155
-
156
-
157
-
158
-
159
-
160
-
161
-
162
-
163
-
164
-
165
-
166
-
167
-
168
-
169
-
170
-
171
 |
 |

(1) For fiscal year 2007, other expense, net includes 1) $11.5 million pretax impairment charge related to the writedown to fair
value in the net carrying value of the Horchow tradename, offset by 2) $4.2 million of other income we received in connection
with the merger of Wedding Channel.com, in which we held a minority interest, and The Knot and 3) $6.0M of other income
related to aged, non-escheatable gift cards.
(2) Comparable revenues include 1) revenues derived from our retail stores open for more than 52 weeks, including stores that have
been relocated or expanded and 2) revenues from our Direct Marketing operation. Comparable revenues exclude 1) revenues of
closed stores, 2) revenues from our discontinued operations (Gurwitch Products, L.L.C. and Kate Spade LLC) and 3) revenues of
our previous Chef's Catalog operations (sold in November 2004).
(3) For an explanation of EBITDA, see "Management's Discussion and Analysis of Financial Condition and Results of Operations
— Non-GAAP Financial Measure-EBITDA."
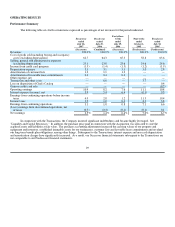
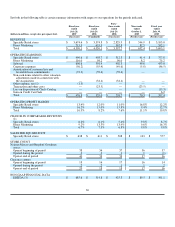
Fiscal Year Ended July 28, 2007 Compared to Fiscal Year Ended July 29, 2006
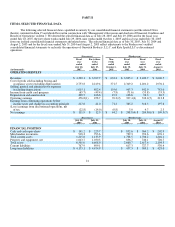
Revenues. Our revenues for fiscal year 2007 of $4,390.1 million increased $360.0 million, or 8.9%, from $4,030.1 million in
fiscal year 2006. The increase in revenues was due to increases in comparable revenues, revenues from new stores and a net increase
in revenues from our Direct Marketing operation. Internet sales by Direct Marketing were $499.0 million, an increase of 22.5%
compared to fiscal year 2006. The increase in internet sales was partially offset by decreases in catalog sales as well as decreases in
revenues from the Horchow brand. Revenues increased in fiscal year 2007 compared to the prior fiscal year at all our operating
companies.
Comparable revenues for fiscal year ended July 28, 2007 were $4,299.2 million compared to $4,030.1 million in fiscal year
2006, representing an increase of 6.7%. Comparable revenues increased in fiscal year 2007 by 6.2% for Specialty Retail stores and
9.2% for Direct Marketing compared to fiscal year 2006. New stores generated sales of $88.7 million in fiscal year 2007.
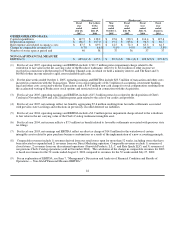
Changes in comparable revenues by fiscal quarter are as follows:
Fiscal Year 2007 Fiscal Year 2006
Fourth
Quarter
Third
Quarter
Second
Quarter
First
Quarter
Fourth
Quarter
Third
Quarter
Second
Quarter
First
Quarter
Specialty Retail stores 6.6% 5.6% 7.0% 5.4% 5.8% 5.7% 4.5% 8.8%
Direct Marketing 9.0% 8.7% 6.1% 14.7% 13.2% 16.5% 13.2% 10.4%
Total 7.0% 6.1% 6.8% 6.8% 7.0% 7.3% 6.0% 9.0%
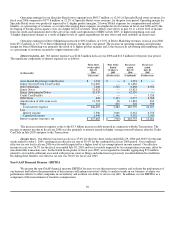
Cost of goods sold including buying and occupancy costs (excluding depreciation). COGS for fiscal year 2007 and fiscal
year 2006 were:
Fiscal year ended
July 28, 2007
(Successor)
Fiscal year ended
July 29, 2006
(Combined)
(in millions, except percentages) $
% of
revenues $
% of
revenues
COGS, before purchase accounting adjustments $ 2,753.8 62.7% $ 2,552.9 63.4%
Purchase accounting adjustments, primarily non-cash charges related to step-up
in carrying value of acquired inventories — — 38.1 0.9
COGS, as reported $ 2,753.8 62.7%$ 2,591.0 64.3%
We present the non-GAAP financial measure COGS, before purchase accounting adjustments because we use this measure to
monitor and evaluate the performance of our business and believe the presentation of this measure will enhance investors' ability to
analyze trends in our business and evaluate our performance relative to other companies in our industry.
The decrease in COGS as reported under GAAP to 62.7% of revenues from 64.3% in the prior fiscal year is primarily due to:
• $38.1 million of non-cash charges included in COGS in fiscal year 2006 primarily related to the step-up in the carrying value
of the acquired inventories recorded in connection with the Transactions; and
• increased margins of approximately 0.6% of revenues primarily attributable to our Specialty Retail stores due
31