Neiman Marcus 2006 Annual Report Download - page 106
Download and view the complete annual report
Please find page 106 of the 2006 Neiman Marcus annual report below. You can navigate through the pages in the report by either clicking on the pages listed below, or by using the keyword search tool below to find specific information within the annual report.-
 1
1 -
2
-
3
-
4
-
5
-
6
-
7
-
8
-
9
-
10
-
11
-
12
-
13
-
14
-
15
-
16
-
17
-
18
-
19
-
20
-
21
-
22
-
23
-
24
-
25
-
26
-
27
-
28
-
29
-
30
-
31
-
32
-
33
-
34
-
35
-
36
-
37
-
38
-
39
-
40
-
41
-
42
-
43
-
44
-
45
-
46
-
47
-
48
-
49
-
50
-
51
-
52
-
53
-
54
-
55
-
56
-
57
-
58
-
59
-
60
-
61
-
62
-
63
-
64
-
65
-
66
-
67
-
68
-
69
-
70
-
71
-
72
-
73
-
74
-
75
-
76
-
77
-
78
-
79
-
80
-
81
-
82
-
83
-
84
-
85
-
86
-
87
-
88
-
89
-
90
-
91
-
92
-
93
-
94
-
95
-
 96
96 -
 97
97 -
 98
98 -
 99
99 -
 100
100 -
 101
101 -
 102
102 -
 103
103 -
 104
104 -
 105
105 -
 106
106 -
 107
107 -
 108
108 -
 109
109 -
 110
110 -
 111
111 -
 112
112 -
 113
113 -
 114
114 -
 115
115 -
 116
116 -
117
-
118
-
119
-
120
-
121
-
122
-
123
-
124
-
125
-
126
-
127
-
128
-
129
-
130
-
131
-
132
-
133
-
134
-
135
-
136
-
137
-
138
-
139
-
140
-
141
-
142
-
143
-
144
-
145
-
146
-
147
-
148
-
149
-
150
-
151
-
152
-
153
-
154
-
155
-
156
-
157
-
158
-
159
-
160
-
161
-
162
-
163
-
164
-
165
-
166
-
167
-
168
-
169
-
170
-
171
 |
 |

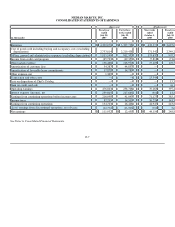
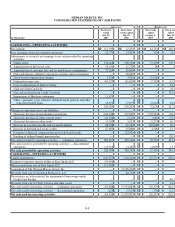
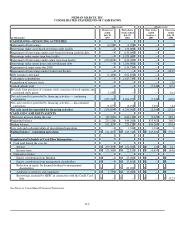
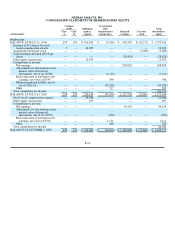
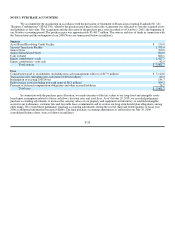
NEIMAN MARCUS, INC.
CONSOLIDATED STATEMENTS OF SHAREHOLDERS' EQUITY
Common
stocks Additional
Accumulated
other Total
(in thousands)
Class
A
Class
B
paid-in
capital
comprehensive
income (loss)
Retained
earnings
Treasury
stock
shareholders'
equity
Predecessor:
BALANCE AT JULY 31, 2004 293 199 $ 491,849 $ (4,536) $ 905,330 $ (22,573) $ 1,370,562
Issuance of 491 shares for stock
based compensation awards 5 — 16,095 — — — 16,100
Acquisition of treasury stock — — — — — (3,088) (3,088)
Cash dividends declared ($0.58 per
share) — — — — (28,428) — (28,428)
Other equity transactions — — 12,470 — — — 12,470
Comprehensive income:
Net earnings — — — — 248,824 — 248,824
Adjustments for fluctuations in fair
market value of financial
instruments, net of tax ($706) — — — (1,114) — — (1,114)
Reclassification of amounts to net
earnings, net of tax of $349 — — — 546 — — 546
Minimum pension liability, net of
tax of ($26,511) — — — (42,248) — — (42,248)
Other — — — 322 — — 322
Total comprehensive income 206,330
BALANCE AT JULY 30, 2005 298 199 520,414 (47,030) 1,125,726 (25,661) 1,573,946
Stock based compensation expense — — 19,032 — — — 19,032
Other equity transactions — — 637 — — — 637
Comprehensive income:
Net earnings — — — — 44,154 — 44,154
Adjustments for fluctuations in fair
market value of financial
instruments, net of tax ($593) — — — (950) — — (950)
Reclassification of amounts to net
earnings, net of tax of $706 — — — 1,114 — — 1,114
Other — — — 246 — — 246
Total comprehensive income 44,564
BALANCE AT OCTOBER 1, 2005 298 199 $ 540,083 $ (46,620)$ 1,169,880 $ (25,661)$ 1,638,179
F-10