Neiman Marcus 2006 Annual Report Download - page 152
Download and view the complete annual report
Please find page 152 of the 2006 Neiman Marcus annual report below. You can navigate through the pages in the report by either clicking on the pages listed below, or by using the keyword search tool below to find specific information within the annual report.-
 1
1 -
2
-
3
-
4
-
5
-
6
-
7
-
8
-
9
-
10
-
11
-
12
-
13
-
14
-
15
-
16
-
17
-
18
-
19
-
20
-
21
-
22
-
23
-
24
-
25
-
26
-
27
-
28
-
29
-
30
-
31
-
32
-
33
-
34
-
35
-
36
-
37
-
38
-
39
-
40
-
41
-
42
-
43
-
44
-
45
-
46
-
47
-
48
-
49
-
50
-
51
-
52
-
53
-
54
-
55
-
56
-
57
-
58
-
59
-
60
-
61
-
62
-
63
-
64
-
65
-
66
-
67
-
68
-
69
-
70
-
71
-
72
-
73
-
74
-
75
-
76
-
77
-
78
-
79
-
80
-
81
-
82
-
83
-
84
-
85
-
86
-
87
-
88
-
89
-
90
-
91
-
92
-
93
-
94
-
95
-
96
-
97
-
98
-
99
-
100
-
101
-
102
-
103
-
104
-
105
-
106
-
107
-
108
-
109
-
110
-
111
-
112
-
113
-
114
-
115
-
116
-
117
-
118
-
119
-
120
-
121
-
122
-
123
-
124
-
125
-
126
-
127
-
128
-
129
-
130
-
131
-
132
-
133
-
134
-
135
-
136
-
137
-
138
-
139
-
140
-
141
-
 142
142 -
 143
143 -
 144
144 -
 145
145 -
 146
146 -
 147
147 -
 148
148 -
 149
149 -
 150
150 -
 151
151 -
 152
152 -
 153
153 -
 154
154 -
 155
155 -
 156
156 -
 157
157 -
 158
158 -
 159
159 -
 160
160 -
 161
161 -
 162
162 -
163
-
164
-
165
-
166
-
167
-
168
-
169
-
170
-
171
 |
 |

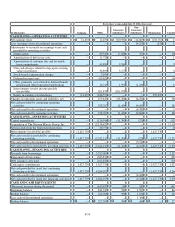
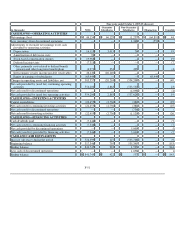
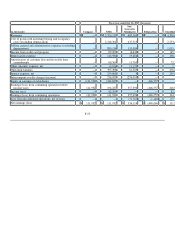
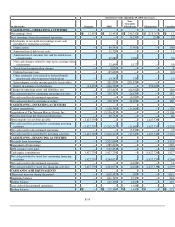
Fiscal year ended July 30, 2005 (Predecessor)
(in thousands) NMG
Guarantor
Subsidiaries
Non-
Guarantor
Subsidiaries Eliminations Consolidated
CASH FLOWS - OPERATING ACTIVITIES
Net earnings (loss) $ 248,824 $ 235,819 $ 82,167 $ (317,986 ) $ 248,824
(Earnings) loss from discontinued operations — — (8,857 ) 3,837 (5,020
Adjustments to reconcile net earnings to net cashprovided by
operating activities:
Depreciation 84,832 18,301 456 — 103,589
Deferred income taxes (15,925 ) — — — (15,925
Loss on disposition of Chef's catalog 7,048 8,300 — — 15,348
Gain on Credit Card Sale — — (6,170 ) — (6,170
Net cash received from Credit Card Sale — — 533,656 — 533,656
Other, primarily costs related to defined benefit pension and
other long-term benefit plans 40,783 1,474 642 — 42,899
Intercompany royalty income payable (receivable) 195,572 (195,572 ) — —
Equity in earnings of subsidiaries (314,149 ) — — 314,149
Changes in operating assets and liabilities, net (119,816 )(51,468 )85,981 — (85,303
Net cash provided by continuing operating activities 127,169 16,854 687,875 — 831,898
Net cash provided by discontinued operations — — 13,502 — 13,502
Net cash provided by operating activities 127,169 16,854 701,377 — 845,400
CASH FLOWS—INVESTING ACTIVITIES
Capital expenditures (172,806 ) (16,887 ) (562 ) — (190,255
Net increase in cash restricted for repayment of borrowings under
Credit Card Facility — — (40,713 ) — (40,713
Proceeds from the sale of Chef's Catalog 14,419 — — — 14,419
Net cash used for continuing investing activities (158,387 ) (16,887 ) (41,275 ) — (216,549
Net cash used for discontinued operations — — (12,280 )— (12,280
Net cash used for investing activities (158,387 )(16,887 )(53,555 )— (228,829
CASH FLOWS—FINANCING ACTIVITIES
Repayment of borrowings on lines of credit (113 ) — — — (113
Repayment of borrowings under Credit Card Facility — — (112,500 ) — (112,500
Acquisitions of treasury stock (3,088 ) — — — (3,088
Proceeds from stock-based compensation awards 16,100 — — — 16,100
Cash dividends paid (27,398 )— — — (27,398
Net cash used for continuing financing activities (14,499 ) — (112,500 ) — (126,999
Net cash used for discontinued operations — — (4,457 )— (4,457
Net cash used for financing activities (14,499 )— (116,957 )— (131,456
CASH AND CASH EQUIVALENTS
(Decrease) increase during the period (45,717 ) (33 ) 530,865 — 485,115
Beginning balance 363,063 828 4,476 — 368,367
Ending balance 317,346 795 535,341 — 853,482
Less cash of discontinued operations — — 889 — 889
Ending balance $ 317,346 $ 795 $ 534,452 $ — $ 852,593
F-52