Neiman Marcus 2006 Annual Report Download - page 159
Download and view the complete annual report
Please find page 159 of the 2006 Neiman Marcus annual report below. You can navigate through the pages in the report by either clicking on the pages listed below, or by using the keyword search tool below to find specific information within the annual report.-
 1
1 -
2
-
3
-
4
-
5
-
6
-
7
-
8
-
9
-
10
-
11
-
12
-
13
-
14
-
15
-
16
-
17
-
18
-
19
-
20
-
21
-
22
-
23
-
24
-
25
-
26
-
27
-
28
-
29
-
30
-
31
-
32
-
33
-
34
-
35
-
36
-
37
-
38
-
39
-
40
-
41
-
42
-
43
-
44
-
45
-
46
-
47
-
48
-
49
-
50
-
51
-
52
-
53
-
54
-
55
-
56
-
57
-
58
-
59
-
60
-
61
-
62
-
63
-
64
-
65
-
66
-
67
-
68
-
69
-
70
-
71
-
72
-
73
-
74
-
75
-
76
-
77
-
78
-
79
-
80
-
81
-
82
-
83
-
84
-
85
-
86
-
87
-
88
-
89
-
90
-
91
-
92
-
93
-
94
-
95
-
96
-
97
-
98
-
99
-
100
-
101
-
102
-
103
-
104
-
105
-
106
-
107
-
108
-
109
-
110
-
111
-
112
-
113
-
114
-
115
-
116
-
117
-
118
-
119
-
120
-
121
-
122
-
123
-
124
-
125
-
126
-
127
-
128
-
129
-
130
-
131
-
132
-
133
-
134
-
135
-
136
-
137
-
138
-
139
-
140
-
141
-
142
-
143
-
144
-
145
-
146
-
147
-
148
-
 149
149 -
 150
150 -
 151
151 -
 152
152 -
 153
153 -
 154
154 -
 155
155 -
 156
156 -
 157
157 -
 158
158 -
 159
159 -
 160
160 -
 161
161 -
 162
162 -
 163
163 -
 164
164 -
 165
165 -
 166
166 -
 167
167 -
 168
168 -
 169
169 -
170
-
171
 |
 |

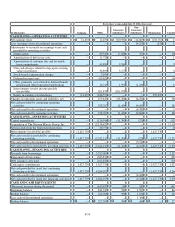
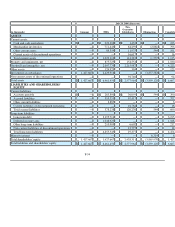
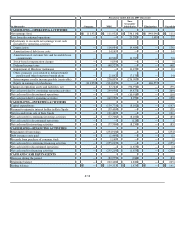
Forty-three weeks ended July 29, 2006 (Successor)
(in thousands) Company NMG
Non-
Guarantor
Subsidiaries Eliminations Consolidated
CASH FLOWS—OPERATING ACTIVITIES
Net earnings (loss) $ 12,455 $ 12,455 $ 246,312 $ (258,767 ) $ 12,455
Loss (earnings) from discontinued operations — — 14,251 (258 ) 13,993
Adjustments to reconcile net earnings to net cash
provided by operating activities:
Depreciation — 89,545 17,405 — 106,950
Amortization of debt issue costs — 11,728 — — 11,728
Amortization of customer lists and favorable lease
commitments — 49,880 9,760 — 59,640
Non-cash charges related to step-up in carrying value
of inventory — 32,890 5,177 — 38,067
Stock-based compensation charges — 3,951 — — 3,951
Deferred income taxes — (65,620 ) — — (65,620
Other, primarily costs related to defined benefit
pension and other long-term benefit plans — 14,745 334 — 15,079
Intercompany royalty income payable (receivable) — 201,878 (201,878 ) —
Equity in earnings of subsidiaries (12,455 ) (246,570 ) — 259,025
Changes in operating assets and liabilities, net — 253,825 (64,922 )— 188,903
Net cash provided by continuing operating activities — 358,707 26,439 — 385,146
Net cash used for discontinued operations — — (4,381 )— (4,381
Net cash provided by operating activities — 358,707 22,058 — 380,765
CASH FLOWS—INVESTING ACTIVITIES
Capital expenditures — (126,546 ) (11,666 ) — (138,212
Acquisition of The Neiman Marcus Group, Inc. — (5,156,423 ) — — (5,156,423
Net proceeds from the Gurwitch Disposition — 40,752 — — 40,752
Intercompany (receivable) payable (1,427,739 )— — 1,427,739
Net cash (used for) provided by continuing investing
activities (1,427,739 ) (5,242,217 ) (11,666 ) 1,427,739 (5,253,883
Net cash used for discontinued operations — — (5,919 )— (5,919
Net cash (used for) provided by investing activities (1,427,739 )(5,242,217 )(17,585 )1,427,739 (5,259,802
CASH FLOWS—FINANCING ACTIVITIES
Proceeds from borrowings — 3,325,000 — — 3,325,000
Repayment of borrowings — (385,812 ) — — (385,812
Debt issuance costs paid — (102,854 ) — — (102,854
Cash equity contributions 1,427,739 1,427,739 — (1,427,739 )1,427,739
Net cash provided by (used for) continuing financing
activities 1,427,739 4,264,073 — (1,427,739 ) 4,264,073
Net cash used for discontinued operations — — (4,168 )— (4,168
Net cash provided by (used for) financing activities 1,427,739 4,264,073 (4,168 )(1,427,739 )4,259,905
CASH AND CASH EQUIVALENTS
(Decrease) increase during the period — (619,437 ) 305 — (619,132
Beginning balance — 841,745 2,515 — 844,260
Ending balance — 222,308 2,820 — 225,128
Less cash of discontinued operations — — 1,388 — 1,388
Ending balance $ — $ 222,308 $ 1,432 $ — $ 223,740
F-59