Neiman Marcus 2006 Annual Report Download - page 129
Download and view the complete annual report
Please find page 129 of the 2006 Neiman Marcus annual report below. You can navigate through the pages in the report by either clicking on the pages listed below, or by using the keyword search tool below to find specific information within the annual report.-
 1
1 -
2
-
3
-
4
-
5
-
6
-
7
-
8
-
9
-
10
-
11
-
12
-
13
-
14
-
15
-
16
-
17
-
18
-
19
-
20
-
21
-
22
-
23
-
24
-
25
-
26
-
27
-
28
-
29
-
30
-
31
-
32
-
33
-
34
-
35
-
36
-
37
-
38
-
39
-
40
-
41
-
42
-
43
-
44
-
45
-
46
-
47
-
48
-
49
-
50
-
51
-
52
-
53
-
54
-
55
-
56
-
57
-
58
-
59
-
60
-
61
-
62
-
63
-
64
-
65
-
66
-
67
-
68
-
69
-
70
-
71
-
72
-
73
-
74
-
75
-
76
-
77
-
78
-
79
-
80
-
81
-
82
-
83
-
84
-
85
-
86
-
87
-
88
-
89
-
90
-
91
-
92
-
93
-
94
-
95
-
96
-
97
-
98
-
99
-
100
-
101
-
102
-
103
-
104
-
105
-
106
-
107
-
108
-
109
-
110
-
111
-
112
-
113
-
114
-
115
-
116
-
117
-
118
-
 119
119 -
 120
120 -
 121
121 -
 122
122 -
 123
123 -
 124
124 -
 125
125 -
 126
126 -
 127
127 -
 128
128 -
 129
129 -
 130
130 -
 131
131 -
 132
132 -
 133
133 -
 134
134 -
 135
135 -
 136
136 -
 137
137 -
 138
138 -
 139
139 -
140
-
141
-
142
-
143
-
144
-
145
-
146
-
147
-
148
-
149
-
150
-
151
-
152
-
153
-
154
-
155
-
156
-
157
-
158
-
159
-
160
-
161
-
162
-
163
-
164
-
165
-
166
-
167
-
168
-
169
-
170
-
171
 |
 |

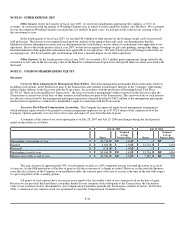
determination, and we expect to update this valuation on an annual basis. In addition, our Compensation Committee considers such
factors as the Company's actual and projected financial results, the principal amount of the Company's indebtedness, the value of the
Company immediately prior to the Transactions, and other factors it believes are material to the valuation process.
We recognized non-cash stock compensation expense of $5.9 million in fiscal year 2007 and $4.0 million for the forty-three
weeks ended July 29, 2006, which is included in selling, general and administrative expenses. At July 28, 2007, unearned non-cash stock-
based compensation that we expect to recognize as expense over the next 5 years aggregates approximately $18.8 million.
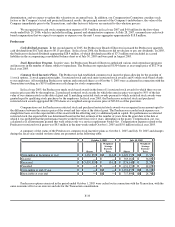
Predecessor
Cash dividend program. In the second quarter of 2005, the Predecessor Board of Directors increased the Predecessor quarterly
cash dividend from $0.13 per share to $0.15 per share. In fiscal year 2006, the Predecessor did not declare or pay any dividends. In 2005,
the Predecessor declared dividends aggregating $28.4 million, of which dividends payable of $7.3 million were included in accrued
liabilities in the accompanying consolidated balance sheet as of July 30, 2005 and were paid in August 2005.
Stock Repurchase Program. In prior years, the Predecessor Board of Directors authorized various stock repurchase programs
and increases in the number of shares subject to repurchase. The Predecessor repurchased 58,504 shares at an average price of $52.74 in
fiscal year 2005.
Common Stock Incentive Plans. The Predecessor had established common stock incentive plans allowing for the granting of
1) stock options, 2) stock appreciation rights, 3) restricted stock and stock units (restricted stock awards) and 4) other stock-based awards
to our employees. All outstanding Predecessor options and restricted shares as of October 5, 2005 were accelerated in connection with the
Transactions resulting in a $19.0 million non-cash charge for stock compensation.
In fiscal year 2005, the Predecessor made stock-based awards in the form of 1) restricted stock awards for which there was no
exercise price payable by the employee, 2) purchased restricted stock awards for which the exercise price was equal to 50% of the fair
value of our common stock on the date of grant and 3) matching restricted stock awards pursuant to which restricted stock awards were
granted equal to qualifying stock purchases by the employees. In fiscal year 2005, the Predecessor restricted stock and purchased
restricted stock awards aggregated 261,998 shares at a weighted-average exercise price of $23.82 as of the grant date.
Compensation cost for Predecessor restricted stock and purchased restricted stock awards was recognized in an amount equal to
the difference between the exercise price of the award and fair value at the date of grant. The Predecessor recorded such expense on a
straight-line basis over the expected life of the award with the offsetting entry to additional paid-in capital. For performance accelerated
restricted stock, the expected life was determined based on the best estimate of the number of years from the grant date to the date at
which it was probable that the performance targets would be met (four or five years, depending on the grant). Compensation cost was
calculated as if all instruments granted that were subject only to a service requirement would vest. Compensation expense related to the
Predecessor restricted stock grants was $8.5 million in the nine-weeks ended October 1, 2005 and $5.0 million in fiscal year 2005.
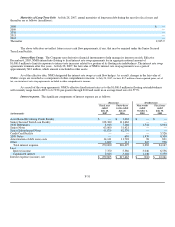
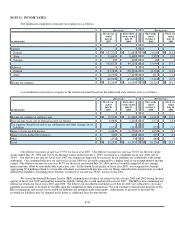
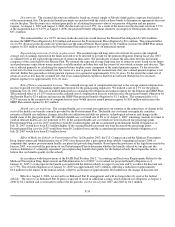
A summary of the status of the Predecessor common stock incentive plans as October 1, 2005 and July 30, 2005 and changes
during the fiscal years ended on those dates are presented in the following table:
October 1, 2005 July 30, 2005
Shares
Weighted-
Average
Exercise
Price Shares
Weighted-
Average
Exercise
Price
Outstanding at beginning of year 3,050,855 $ 38.12 3,009,155 $ 33.35
Granted — — 569,161 56.89
Exercised (3,050,855 ) 38.12 (376,140 ) 28.38
Canceled — — (151,321 )38.87
Outstanding at end of year — $ — 3,050,855 $ 38.12
Exercisable at year end — $ — 717,890 $ 28.76
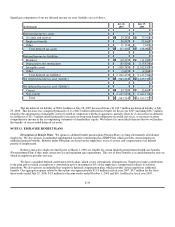
Predecessor options exercised in the period ended October 1, 2005 were cashed out in connection with the Transaction, with the
same economic effect as an exercise and sale for the Transaction consideration.
F-33