Neiman Marcus 2006 Annual Report Download - page 12
Download and view the complete annual report
Please find page 12 of the 2006 Neiman Marcus annual report below. You can navigate through the pages in the report by either clicking on the pages listed below, or by using the keyword search tool below to find specific information within the annual report.-
 1
1 -
 2
2 -
 3
3 -
 4
4 -
 5
5 -
 6
6 -
 7
7 -
 8
8 -
 9
9 -
 10
10 -
 11
11 -
 12
12 -
 13
13 -
 14
14 -
 15
15 -
 16
16 -
 17
17 -
 18
18 -
 19
19 -
 20
20 -
 21
21 -
 22
22 -
23
-
24
-
25
-
26
-
27
-
28
-
29
-
30
-
31
-
32
-
33
-
34
-
35
-
36
-
37
-
38
-
39
-
40
-
41
-
42
-
43
-
44
-
45
-
46
-
47
-
48
-
49
-
50
-
51
-
52
-
53
-
54
-
55
-
56
-
57
-
58
-
59
-
60
-
61
-
62
-
63
-
64
-
65
-
66
-
67
-
68
-
69
-
70
-
71
-
72
-
73
-
74
-
75
-
76
-
77
-
78
-
79
-
80
-
81
-
82
-
83
-
84
-
85
-
86
-
87
-
88
-
89
-
90
-
91
-
92
-
93
-
94
-
95
-
96
-
97
-
98
-
99
-
100
-
101
-
102
-
103
-
104
-
105
-
106
-
107
-
108
-
109
-
110
-
111
-
112
-
113
-
114
-
115
-
116
-
117
-
118
-
119
-
120
-
121
-
122
-
123
-
124
-
125
-
126
-
127
-
128
-
129
-
130
-
131
-
132
-
133
-
134
-
135
-
136
-
137
-
138
-
139
-
140
-
141
-
142
-
143
-
144
-
145
-
146
-
147
-
148
-
149
-
150
-
151
-
152
-
153
-
154
-
155
-
156
-
157
-
158
-
159
-
160
-
161
-
162
-
163
-
164
-
165
-
166
-
167
-
168
-
169
-
170
-
171
 |
 |

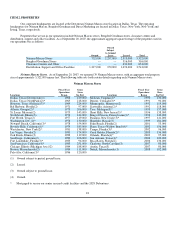
The majority of the merchandise we purchase is initially received at one of our centralized distribution facilities. To support our
Specialty Retail stores, we utilize a primary distribution facility in Longview, Texas, a regional distribution facility in Totowa, New
Jersey and five regional service centers. We also operate two distribution facilities in the Dallas-Fort Worth area to support our Direct
Marketing operation.
Our distribution facilities are linked electronically to our various merchandising staffs to facilitate the distribution of goods to
our stores. We utilize electronic data interchange (EDI) technology with certain of our vendors, which is designed to move merchandise
onto the selling floor quickly and cost-effectively by allowing vendors to deliver floor-ready merchandise to the distribution facilities. In
addition, we utilize high-speed automated conveyor systems capable of scanning the bar coded labels on incoming cartons of
merchandise and directing the cartons to the proper processing areas. Many types of merchandise are processed in the receiving area and
immediately "cross docked" to the shipping dock for delivery to the stores. Certain processing areas are staffed with personnel equipped
with hand-held radio frequency terminals that can scan a vendor's bar code and transmit the necessary information to a computer to record
merchandise on hand. We utilize third-party carriers to distribute our merchandise to individual stores.
With respect to the Specialty Retail stores, the majority of the merchandise is held in our retail stores. We primarily operate on a
pre-distribution model through which we allocate merchandise on our initial purchase orders to each store. This merchandise is shipped
from our vendors to our distribution facilities for delivery to designated stores. We closely monitor the inventory levels and assortments
in our retail stores to facilitate reorder and replenishment decisions, satisfy customer demand and maximize sales. Transfers of goods
between stores are made primarily at the direction of merchandising personnel and, to a lesser extent, by store management primarily to
fulfill customer requests.
We also maintain certain inventories at the Longview distribution facility. The goods held at the Longview distribution facility
consist primarily of goods held in limited assortment or quantity by our stores and replenishment goods available to stores achieving high
initial sales levels. With our "locker stock" inventory management program, we maintain a portion of our most in-demand and high
fashion merchandise at our distribution facilities. For products stored in locker stock, we can ship replenishment merchandise to the
stores that demonstrate the highest customer demand. In addition, our sales associates can use the program to ship items directly to our
customers, thereby improving customer service and increasing productivity. This program also helps us to restock inventory at individual
stores more efficiently, to maximize the opportunity for full-price selling and to minimize the potential risks related to excess inventories.
We plan to continue to expand this program to deliver goods to our customers more quickly and to enhance the allocation of goods to our
stores.
Capital Investments
We make capital investments annually to support our long-term business goals and objectives. We invest capital in new and
existing stores, distribution and support facilities as well as information technology. We have gradually increased the number of our
stores over the past ten years, growing our full-line Neiman Marcus and Bergdorf Goodman store base from 27 stores at the beginning of
fiscal year 1997 to our current 41 stores.
We invest capital in the development and construction of new stores in both existing and new markets. We conduct extensive
demographic, marketing and lifestyle research to identify attractive retail markets with a high concentration of our target customers prior
to our decision to construct a new store. We compete with other retailers for real estate opportunities principally on the basis of our ability
to attract customers. In addition to the construction of new stores, we also invest in the on-going maintenance of our stores to ensure an
elegant shopping experience for our customers. Capital expenditures for existing stores range from minor renovations of certain areas
within the store to major remodels and renovations and store expansions. We are focused on operating only in attractive markets that can
profitably support our stores and are focused on maintaining the quality of our stores and, consequently, our brand. With respect to our
major remodels, we only expand after extensive analysis of our projected returns on capital. We generally experience an increase in both
total sales and sales per square foot at stores that undergo a remodel or expansion.
We also believe capital investments for information technology in our stores, distribution facilities and support functions are
necessary to support our business strategies. As a result, we are continually upgrading our information systems to improve efficiency and
productivity.
In the past three fiscal years, we have made capital expenditures aggregating $502 million related primarily to:
• the construction of new stores in San Antonio, Boca Raton, Charlotte, Austin and Natick (suburban Boston);
9