NVIDIA 2016 Annual Report Download - page 76
Download and view the complete annual report
Please find page 76 of the 2016 NVIDIA annual report below. You can navigate through the pages in the report by either clicking on the pages listed below, or by using the keyword search tool below to find specific information within the annual report.-
 1
1 -
2
-
3
-
4
-
5
-
6
-
7
-
8
-
9
-
10
-
11
-
12
-
13
-
14
-
15
-
16
-
17
-
18
-
19
-
20
-
21
-
22
-
23
-
24
-
25
-
26
-
27
-
28
-
29
-
30
-
31
-
32
-
33
-
34
-
35
-
36
-
37
-
38
-
39
-
40
-
41
-
42
-
43
-
44
-
45
-
46
-
47
-
48
-
49
-
50
-
51
-
52
-
53
-
54
-
55
-
56
-
57
-
58
-
59
-
60
-
61
-
62
-
63
-
64
-
65
-
 66
66 -
 67
67 -
 68
68 -
 69
69 -
 70
70 -
 71
71 -
 72
72 -
 73
73 -
 74
74 -
 75
75 -
 76
76 -
 77
77 -
 78
78 -
 79
79 -
 80
80 -
 81
81 -
 82
82 -
 83
83 -
 84
84 -
 85
85 -
 86
86 -
87
-
88
-
89
-
90
-
91
-
92
-
93
-
94
-
95
-
96
-
97
-
98
-
99
-
100
-
101
-
102
-
103
-
104
-
105
-
106
-
107
-
108
-
109
-
110
-
111
-
112
-
113
-
114
-
115
-
116
-
117
-
118
-
119
-
120
-
121
-
122
-
123
-
124
-
125
-
126
-
127
-
128
-
129
-
130
-
131
-
132
-
133
-
134
-
135
-
136
-
137
-
138
-
139
-
140
-
141
-
142
-
143
-
144
-
145
-
146
-
147
-
148
-
149
-
150
-
151
-
152
-
153
-
154
-
155
-
156
-
157
-
158
-
159
-
160
-
161
-
162
-
163
-
164
-
165
-
166
-
167
-
168
-
169
-
170
-
171
-
172
-
173
-
174
-
175
-
176
-
177
-
178
-
179
-
180
-
181
-
182
-
183
-
184
-
185
-
186
-
187
-
188
-
189
-
190
-
191
-
192
-
193
-
194
-
195
-
196
-
197
-
198
-
199
-
200
-
201
-
202
-
203
-
204
-
205
-
206
-
207
-
208
-
209
-
210
-
211
-
212
-
213
-
214
-
215
-
216
-
217
-
218
-
219
-
220
-
221
-
222
-
223
-
224
-
225
-
226
-
227
-
228
-
229
-
230
-
231
-
232
-
233
-
234
-
235
-
236
-
237
-
238
-
239
-
240
-
241
-
242
-
243
-
244
-
245
-
246
-
247
-
248
-
249
-
250
 |
 |

58
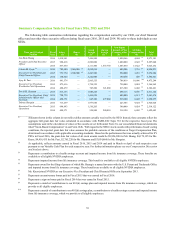
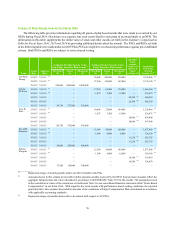
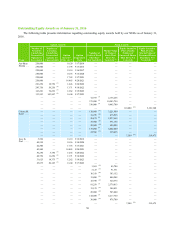
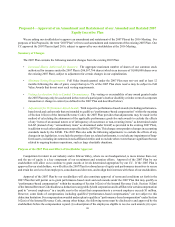
Outstanding Equity Awards as of January 31, 2016
The following table presents information regarding outstanding equity awards held by our NEOs as of January 31,
2016.
Name
Option Awards Stock Awards
Number of
Securities
Underlying
Unexercised
Options (#)
Exercisable
Number of
Securities
Underlying
Unexercised
Options (#)
Unexercisable
Option
Exercise
Price ($) (1)
Option
Expiration
Date
Number of
Units of Stock
That Have
Not Vested (#)
Market Value
of Units of
Stock That
Have Not
Vested ($) (2)
Equity Incentive
Plan Awards:
Number of
Unearned Shares
That Have Not
Vested (#)
Equity Incentive
Plan Awards:
Market Value of
Unearned Shares
That Have Not
Vested ($) (2)
Jen-Hsun
Huang . . . 250,000 — 10.20 3/17/2016 — — — —
250,000 — 15.94 9/15/2016 — — — —
250,000 — 18.10 3/16/2017 — — — —
250,000 — 10.56 9/14/2020 — — — —
250,000 — 17.62 3/17/2021 — — — —
250,000 — 14.465 9/20/2021 — — — —
281,250 18,750 (3) 14.46 3/20/2022 — — — —
243,750 56,250 (4) 13.71 9/18/2022 — — — —
163,281 74,219 (5) 12.62 3/19/2023 — — — —
133,593 103,907 (6) 16.00 9/17/2023 — — — —
— — — — 72,935 (7) 2,136,266 — —
— — — — 375,000 (8) 10,983,750 — —
— — — — 330,000 (9) 9,665,700 — —
— — — — — — 110,000 (10) 3,221,900
Colette M.
Kress . . . . — — — — 110,000 (11) 3,221,900 — —
— — — — 16,250 (12) 475,963 — —
— — — — 96,875 (8) 2,837,469 — —
— — — — 19,500 (13) 571,155 — —
— — — — 22,500 (14) 659,025 — —
— — — — 138,000 (9) 4,042,020 — —
— — — — 22,500 (15) 659,025 — —
— — — — — — 7,500 (10) 219,675
Ajay K.
Puri . . . . . 5,524 — 18.10 3/16/2016 — — — —
44,530 — 10.56 9/14/2020 — — — —
42,500 — 17.53 3/15/2021 — — — —
42,500 — 14.465 9/20/2021 — — — —
56,250 3,750 (3) 14.46 3/20/2022 — — — —
48,750 11,250 (4) 13.71 9/18/2022 — — — —
31,625 14,375 (5) 12.62 3/19/2023 — — — —
25,875 20,125 (6) 16.00 9/17/2023 — — — —
— — — — 1,563 (16) 45,780 — —
— — — — 3,125 (17) 91,531 — —
— — — — 10,350 (18) 303,152 — —
— — — — 13,800 (11) 404,202 — —
— — — — 10,938 (12) 320,374 — —
— — — — 81,250 (8) 2,379,813 — —
— — — — 13,125 (13) 384,431 — —
— — — — 20,000 (14) 585,800 — —
— — — — 144,000 (9) 4,217,760 — —
— — — — 30,000 (15) 878,700 — —
— — — — — — 7,500 (10) 219,675