NVIDIA 2016 Annual Report Download - page 69
Download and view the complete annual report
Please find page 69 of the 2016 NVIDIA annual report below. You can navigate through the pages in the report by either clicking on the pages listed below, or by using the keyword search tool below to find specific information within the annual report.-
 1
1 -
2
-
3
-
4
-
5
-
6
-
7
-
8
-
9
-
10
-
11
-
12
-
13
-
14
-
15
-
16
-
17
-
18
-
19
-
20
-
21
-
22
-
23
-
24
-
25
-
26
-
27
-
28
-
29
-
30
-
31
-
32
-
33
-
34
-
35
-
36
-
37
-
38
-
39
-
40
-
41
-
42
-
43
-
44
-
45
-
46
-
47
-
48
-
49
-
50
-
51
-
52
-
53
-
54
-
55
-
56
-
57
-
58
-
 59
59 -
 60
60 -
 61
61 -
 62
62 -
 63
63 -
 64
64 -
 65
65 -
 66
66 -
 67
67 -
 68
68 -
 69
69 -
 70
70 -
 71
71 -
 72
72 -
 73
73 -
 74
74 -
 75
75 -
 76
76 -
 77
77 -
 78
78 -
 79
79 -
80
-
81
-
82
-
83
-
84
-
85
-
86
-
87
-
88
-
89
-
90
-
91
-
92
-
93
-
94
-
95
-
96
-
97
-
98
-
99
-
100
-
101
-
102
-
103
-
104
-
105
-
106
-
107
-
108
-
109
-
110
-
111
-
112
-
113
-
114
-
115
-
116
-
117
-
118
-
119
-
120
-
121
-
122
-
123
-
124
-
125
-
126
-
127
-
128
-
129
-
130
-
131
-
132
-
133
-
134
-
135
-
136
-
137
-
138
-
139
-
140
-
141
-
142
-
143
-
144
-
145
-
146
-
147
-
148
-
149
-
150
-
151
-
152
-
153
-
154
-
155
-
156
-
157
-
158
-
159
-
160
-
161
-
162
-
163
-
164
-
165
-
166
-
167
-
168
-
169
-
170
-
171
-
172
-
173
-
174
-
175
-
176
-
177
-
178
-
179
-
180
-
181
-
182
-
183
-
184
-
185
-
186
-
187
-
188
-
189
-
190
-
191
-
192
-
193
-
194
-
195
-
196
-
197
-
198
-
199
-
200
-
201
-
202
-
203
-
204
-
205
-
206
-
207
-
208
-
209
-
210
-
211
-
212
-
213
-
214
-
215
-
216
-
217
-
218
-
219
-
220
-
221
-
222
-
223
-
224
-
225
-
226
-
227
-
228
-
229
-
230
-
231
-
232
-
233
-
234
-
235
-
236
-
237
-
238
-
239
-
240
-
241
-
242
-
243
-
244
-
245
-
246
-
247
-
248
-
249
-
250
 |
 |

51
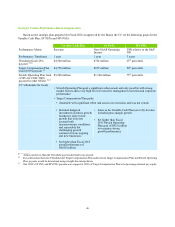
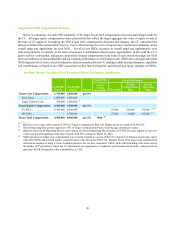
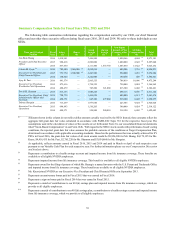
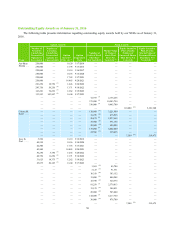
David M. Shannon - Executive Vice President, Chief Administrative Officer and Secretary
Fiscal 2015
Pay ($) Fiscal 2016
Pay ($) Change
Fiscal 2016
Pay Relative
to Peer
Group
(percentile)
Fiscal 2016 Shares
Threshold
Target
Compensation
Plan
Stretch
Operating
Plan
Target Cash Compensation. . . 1,000,000 1,000,000 —
Base Salary. . . . . . . . . . . . . . 800,000 800,000
Target Variable Cash. . . . . . . 200,000 200,000 (1)
Target Equity Compensation .1,348,630 1,506,285 up 12%
SY PSUs . . . . . . . . . . . . . . . . 903,640 984,500 12,500 50,000 100,000 (2)
MY PSUs . . . . . . . . . . . . . . . — 78,760 1,000 4,000 8,000
RSUs. . . . . . . . . . . . . . . . . . . 444,990 443,025 (3)
Target Total Compensation. . . 2,348,630 2,506,285 up 7% 75th (4)
__________
(1) Based on our revenue achievement of 149% of Target Compensation Plan, Mr. Shannon earned an award of $298,113.
(2) Based on Non-GAAP Operating Income achievement, the Stretch Operating Plan number of SY PSUs became eligible to vest over
a four-year period beginning on the date of grant, with 25% vesting on March 16, 2016.
(3) In Fiscal 2016, Mr. Shannon was granted a total of 22,500 RSUs.
(4) Total target compensation was set at the higher end of the market due to responsibility and scope increase as head of human resources,
legal and intellectual property licensing. The target total compensation increase for Fiscal 2016 was structured entirely in the form
of performance-based equity, to further align Mr. Shannon’s interests with stockholders and long-term company performance.
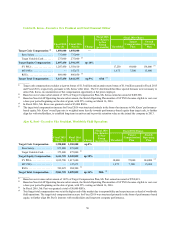
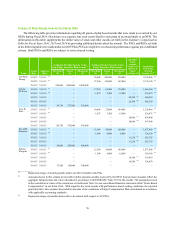
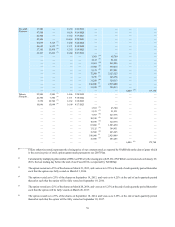
Debora Shoquist - Executive Vice President, Operations
Fiscal 2015
Pay ($) Fiscal 2016
Pay ($) Change
Fiscal 2016
Pay Relative
to Peer
Group
(percentile)
Fiscal 2016 Shares
Threshold
Target
Compensation
Plan
Stretch
Operating
Plan
Target Cash Compensation . . . . . 850,000 850,000 —
Base Salary . . . . . . . . . . . . . . . . 700,000 700,000
Target Variable Cash . . . . . . . . . 150,000 150,000 (1)
Target Equity Compensation. . . . 1,409,185 1,752,410 up 24%
SY PSUs. . . . . . . . . . . . . . . . . . . 810,160 984,500 12,500 50,000 100,000 (2)
MY PSUs . . . . . . . . . . . . . . . . . . — 118,140 1,500 6,000 12,000
RSUs . . . . . . . . . . . . . . . . . . . . . 599,025 649,770 (3)
Target Total Compensation . . . . . 2,259,185 2,602,410 up 15% > 75th (4)
__________
(1) Based on our revenue achievement of 149% of Target Compensation Plan, Ms. Shoquist earned an award of $223,585.
(2) Based on Non-GAAP Operating Income achievement, the Stretch Operating Plan number of SY PSUs became eligible to vest over
a four-year period beginning on the date of grant, with 25% vesting on March 16, 2016.
(3) In Fiscal 2016, Ms. Shoquist was granted a total of 33,000 RSUs.
(4) Total target compensation was set at the higher end of the market due to responsibility and scope increase as head of chips and
systems operations, facilities and information technology. The target total compensation increase for Fiscal 2016 was structured
primarily in the form of performance-based equity, to further align Ms. Shoquist’s interests with stockholders and long-term company
performance.