NVIDIA 2016 Annual Report Download - page 73
Download and view the complete annual report
Please find page 73 of the 2016 NVIDIA annual report below. You can navigate through the pages in the report by either clicking on the pages listed below, or by using the keyword search tool below to find specific information within the annual report.-
 1
1 -
2
-
3
-
4
-
5
-
6
-
7
-
8
-
9
-
10
-
11
-
12
-
13
-
14
-
15
-
16
-
17
-
18
-
19
-
20
-
21
-
22
-
23
-
24
-
25
-
26
-
27
-
28
-
29
-
30
-
31
-
32
-
33
-
34
-
35
-
36
-
37
-
38
-
39
-
40
-
41
-
42
-
43
-
44
-
45
-
46
-
47
-
48
-
49
-
50
-
51
-
52
-
53
-
54
-
55
-
56
-
57
-
58
-
59
-
60
-
61
-
62
-
 63
63 -
 64
64 -
 65
65 -
 66
66 -
 67
67 -
 68
68 -
 69
69 -
 70
70 -
 71
71 -
 72
72 -
 73
73 -
 74
74 -
 75
75 -
 76
76 -
 77
77 -
 78
78 -
 79
79 -
 80
80 -
 81
81 -
 82
82 -
 83
83 -
84
-
85
-
86
-
87
-
88
-
89
-
90
-
91
-
92
-
93
-
94
-
95
-
96
-
97
-
98
-
99
-
100
-
101
-
102
-
103
-
104
-
105
-
106
-
107
-
108
-
109
-
110
-
111
-
112
-
113
-
114
-
115
-
116
-
117
-
118
-
119
-
120
-
121
-
122
-
123
-
124
-
125
-
126
-
127
-
128
-
129
-
130
-
131
-
132
-
133
-
134
-
135
-
136
-
137
-
138
-
139
-
140
-
141
-
142
-
143
-
144
-
145
-
146
-
147
-
148
-
149
-
150
-
151
-
152
-
153
-
154
-
155
-
156
-
157
-
158
-
159
-
160
-
161
-
162
-
163
-
164
-
165
-
166
-
167
-
168
-
169
-
170
-
171
-
172
-
173
-
174
-
175
-
176
-
177
-
178
-
179
-
180
-
181
-
182
-
183
-
184
-
185
-
186
-
187
-
188
-
189
-
190
-
191
-
192
-
193
-
194
-
195
-
196
-
197
-
198
-
199
-
200
-
201
-
202
-
203
-
204
-
205
-
206
-
207
-
208
-
209
-
210
-
211
-
212
-
213
-
214
-
215
-
216
-
217
-
218
-
219
-
220
-
221
-
222
-
223
-
224
-
225
-
226
-
227
-
228
-
229
-
230
-
231
-
232
-
233
-
234
-
235
-
236
-
237
-
238
-
239
-
240
-
241
-
242
-
243
-
244
-
245
-
246
-
247
-
248
-
249
-
250
 |
 |

55
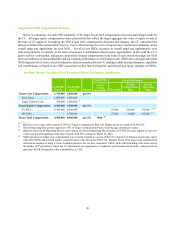
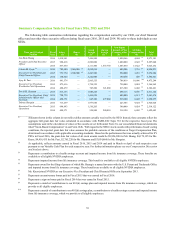
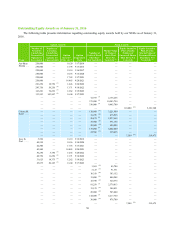
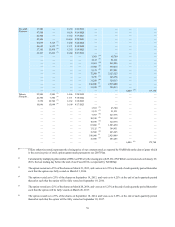
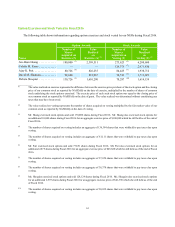
Summary Compensation Table for Fiscal Years 2016, 2015 and 2014
The following table summarizes information regarding the compensation earned by our CEO, our chief financial
officer and our other three executive officers during fiscal years 2016, 2015 and 2014. We refer to these individuals as our
NEOs.
Name and Principal
Position Fiscal
Year Salary
($) Bonus
($)
Stock
Awards
($) (1)
Option
Awards
($) (1)
Non-Equity
Incentive Plan
Compensation
($) (2)
All Other
Compensation
($) Total
($)
Jen-Hsun Huang . . . . . . . . . . . . 2016 1,018,941 — 7,456,900 — 1,490,566 4,694 (3) 9,971,101
President and Chief Executive
Officer 2015 998,418 — 6,896,000 — 1,400,000 2,622 (4) 9,297,040
2014 837,450 — 2,111,400 1,657,750 1,405,030 13,622 (5) 6,025,252
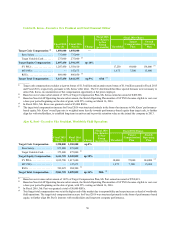
Colette M. Kress (6) . . . . . . . . . . 2016 789,680 1,000,000 (7) 2,692,935 — 409,906 3,710 (9) 4,896,231
Executive Vice President and
Chief Financial Officer 2015 773,774 1,500,000 (8) 2,247,920 — 550,000 3,210 (9) 5,074,904
2014 158,945 — 3,242,800 — 190,668 428 (4) 3,592,841
Ajay K. Puri . . . . . . . . . . . . . . . 2016 891,574 — 2,865,555 — 708,019 10,096 (10) 4,475,244
Executive Vice President,
Worldwide Field Operations 2015 873,616 — 1,734,325 — 750,000 9,024 (9) 3,366,965
2014 498,479 — 745,200 321,080 815,300 6,402 (9) 2,386,461
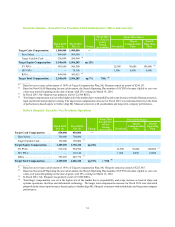
David M. Shannon . . . . . . . . . . 2016 815,153 — 1,688,220 — 298,113 9,656 (9) 2,811,142
Executive Vice President, Chief
Administrative Officer and
Secretary
2015 798,735 — 1,455,830 — 400,000 6,511 (9) 2,661,076
2014 498,371 — 645,300 277,804 530,200 6,402 (9) 1,958,077
Debora Shoquist . . . . . . . . . . . . 2016 713,259 — 1,977,660 — 223,585 9,524 (9) 2,924,028
Executive Vice President,
Operations 2015 698,893 — 1,510,205 — 300,000 9,024 (9) 2,518,122
2014 498,371 — 558,900 240,810 318,120 6,402 (9) 1,622,603
__________
(1) Amounts shown in this column do not reflect dollar amounts actually received by the NEO. Instead, these amounts reflect the
aggregate full grant date fair value calculated in accordance with FASB ASC Topic 718 for the respective fiscal year. The
assumptions used in the calculation of values of the awards are set forth under Note 2 to our consolidated financial statements
titled “Stock-Based Compensation” in our Form 10-K. With regard to the NEOs’ stock awards with performance-based vesting
conditions, the reported grant date fair value assumes the probable outcome of the conditions at Target Compensation Plan,
determined in accordance with applicable accounting standards. Based on the performance that was actually achieved for SY
PSUs in Fiscal 2016, the grant date fair values of all stock awards would be $9,826,300 for Mr. Huang, $4,179,195 for Ms.
Kress, $4,416,435 for Mr. Puri, $2,765,220 for Mr. Shannon and $3,054,660 for Ms. Shoquist.
(2) As applicable, reflects amounts earned in Fiscal 2016, 2015 and 2014 and paid in March or April of each respective year
pursuant to our Variable Cash Plan for each respective year. For further information please see our Compensation Discussion
and Analysis above.
(3) Represents a contribution to a health savings account and imputed income from life insurance coverage. These benefits are
available to all eligible NVIDIA employees.
(4) Represents imputed income from life insurance coverage. This benefit is available to all eligible NVIDIA employees.
(5) Represents award for the filing of patents of which Mr. Huang is a named inventor with the U.S. Patent and Trademark Office
and imputed income from life insurance coverage. These benefits are available to all eligible NVIDIA employees.
(6) Ms. Kress joined NVIDIA as our Executive Vice President and Chief Financial Officer in September 2013.
(7) Represents an anniversary bonus paid in Fiscal 2015 that was earned in Fiscal 2016.
(8) Represents a sign-on bonus paid in Fiscal 2014 that was earned in Fiscal 2015.
(9) Represents a match of contributions to our 401(k) savings plan and imputed income from life insurance coverage, which we
provide to all eligible employees.
(10) Represents a match of contributions to our 401(k) savings plan, a contribution to a health savings account and imputed income
from life insurance coverage, which we provide to all eligible employees.