NVIDIA 2016 Annual Report Download - page 67
Download and view the complete annual report
Please find page 67 of the 2016 NVIDIA annual report below. You can navigate through the pages in the report by either clicking on the pages listed below, or by using the keyword search tool below to find specific information within the annual report.-
 1
1 -
2
-
3
-
4
-
5
-
6
-
7
-
8
-
9
-
10
-
11
-
12
-
13
-
14
-
15
-
16
-
17
-
18
-
19
-
20
-
21
-
22
-
23
-
24
-
25
-
26
-
27
-
28
-
29
-
30
-
31
-
32
-
33
-
34
-
35
-
36
-
37
-
38
-
39
-
40
-
41
-
42
-
43
-
44
-
45
-
46
-
47
-
48
-
49
-
50
-
51
-
52
-
53
-
54
-
55
-
56
-
 57
57 -
 58
58 -
 59
59 -
 60
60 -
 61
61 -
 62
62 -
 63
63 -
 64
64 -
 65
65 -
 66
66 -
 67
67 -
 68
68 -
 69
69 -
 70
70 -
 71
71 -
 72
72 -
 73
73 -
 74
74 -
 75
75 -
 76
76 -
 77
77 -
78
-
79
-
80
-
81
-
82
-
83
-
84
-
85
-
86
-
87
-
88
-
89
-
90
-
91
-
92
-
93
-
94
-
95
-
96
-
97
-
98
-
99
-
100
-
101
-
102
-
103
-
104
-
105
-
106
-
107
-
108
-
109
-
110
-
111
-
112
-
113
-
114
-
115
-
116
-
117
-
118
-
119
-
120
-
121
-
122
-
123
-
124
-
125
-
126
-
127
-
128
-
129
-
130
-
131
-
132
-
133
-
134
-
135
-
136
-
137
-
138
-
139
-
140
-
141
-
142
-
143
-
144
-
145
-
146
-
147
-
148
-
149
-
150
-
151
-
152
-
153
-
154
-
155
-
156
-
157
-
158
-
159
-
160
-
161
-
162
-
163
-
164
-
165
-
166
-
167
-
168
-
169
-
170
-
171
-
172
-
173
-
174
-
175
-
176
-
177
-
178
-
179
-
180
-
181
-
182
-
183
-
184
-
185
-
186
-
187
-
188
-
189
-
190
-
191
-
192
-
193
-
194
-
195
-
196
-
197
-
198
-
199
-
200
-
201
-
202
-
203
-
204
-
205
-
206
-
207
-
208
-
209
-
210
-
211
-
212
-
213
-
214
-
215
-
216
-
217
-
218
-
219
-
220
-
221
-
222
-
223
-
224
-
225
-
226
-
227
-
228
-
229
-
230
-
231
-
232
-
233
-
234
-
235
-
236
-
237
-
238
-
239
-
240
-
241
-
242
-
243
-
244
-
245
-
246
-
247
-
248
-
249
-
250
 |
 |
49
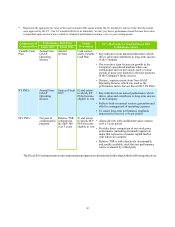
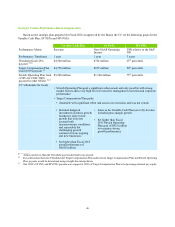
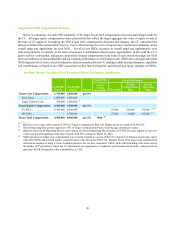
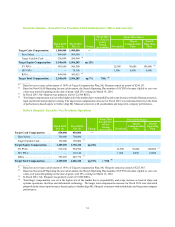
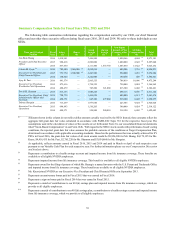
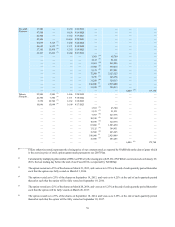
Target Fiscal 2016 Compensation Decisions
Below is a summary, for each NEO separately, of the target Fiscal 2016 compensation decisions and changes made by
the CC. All target equity compensation values presented below reflect the target aggregate fair value of equity awards at
the time of CC approval. In making the NEO Fiscal 2016 compensation decisions and changes, the CC considered the
factors set forth in the section titled “Factors Used in Determining Executive Compensation” and focused primarily on the
overall target pay opportunity for each NEO. For all of our NEOs, increases in overall target pay opportunities were
delivered primarily, or entirely, in the form of increases to performance-based equity opportunities, in line with the CC’s
goal to deliver a substantial, and greater, proportion of target compensation in the form of such awards that align our NEO
interests with those of our stockholders and our company performance over the longer-term. Differences amongst individual
NEO target pay levels were a result of subjective factors considered by the CC relating to individual performance, capability
and contributions, as based on our CEO’s assessment (other than for himself), and internal pay equity amongst our NEOs.
Jen-Hsun Huang - President, Chief Executive Officer, Co-Founder and Director
Fiscal 2015
Pay ($) Fiscal 2016
Pay ($) Change
Fiscal 2016
Pay Relative
to Peer
Group
(percentile)
Fiscal 2016 Shares
Threshold
Target
Compensation
Plan
Stretch
Operating
Plan
Target Cash Compensation. . 1,700,000 2,000,000 up 18%
Base Salary . . . . . . . . . . . . . 1,000,000 1,000,000
Target Variable Cash. . . . . . 700,000 1,000,000 (1)
Target Equity Compensation 6,300,000 7,000,000 up 11%
SY PSUs . . . . . . . . . . . . . . . 6,300,000 4,600,000 55,000 220,000 330,000 (2) (3)
MY PSUs . . . . . . . . . . . . . . — 2,400,000 27,500 110,000 165,000 (2)
Target Total Compensation. . 8,000,000 9,000,000 up 13% 50th (4)
__________
(1) Based on our revenue achievement of 149% of Target Compensation Plan, Mr. Huang earned an award of $1,490,566.
(2) Stretch Operating Plan payout capped at 150% of Target Compensation Plan to help manage internal pay equity.
(3) Based on Non-GAAP Operating Income achievement, the Stretch Operating Plan number of SY PSUs became eligible to vest over
a four-year period beginning on the date of grant, with 25% vesting on March 16, 2016.
(4) Market position of target total compensation was set at the median as a result of the CC’s objective to balance internal pay equity
with other NEOs and external market competitiveness with other peer CEOs. Mr. Huang’s Fiscal 2016 target cash compensation
reflected an increase to bring it closer to market practices for our peer companies’ CEOs, while still remaining at the lower end of
the market (25th percentile), which the CC determined was appropriate to emphasize performance-based equity compensation in
particular for Mr. Huang due to his responsibility as CEO.