NVIDIA 2016 Annual Report Download - page 186
Download and view the complete annual report
Please find page 186 of the 2016 NVIDIA annual report below. You can navigate through the pages in the report by either clicking on the pages listed below, or by using the keyword search tool below to find specific information within the annual report.-
 1
1 -
2
-
3
-
4
-
5
-
6
-
7
-
8
-
9
-
10
-
11
-
12
-
13
-
14
-
15
-
16
-
17
-
18
-
19
-
20
-
21
-
22
-
23
-
24
-
25
-
26
-
27
-
28
-
29
-
30
-
31
-
32
-
33
-
34
-
35
-
36
-
37
-
38
-
39
-
40
-
41
-
42
-
43
-
44
-
45
-
46
-
47
-
48
-
49
-
50
-
51
-
52
-
53
-
54
-
55
-
56
-
57
-
58
-
59
-
60
-
61
-
62
-
63
-
64
-
65
-
66
-
67
-
68
-
69
-
70
-
71
-
72
-
73
-
74
-
75
-
76
-
77
-
78
-
79
-
80
-
81
-
82
-
83
-
84
-
85
-
86
-
87
-
88
-
89
-
90
-
91
-
92
-
93
-
94
-
95
-
96
-
97
-
98
-
99
-
100
-
101
-
102
-
103
-
104
-
105
-
106
-
107
-
108
-
109
-
110
-
111
-
112
-
113
-
114
-
115
-
116
-
117
-
118
-
119
-
120
-
121
-
122
-
123
-
124
-
125
-
126
-
127
-
128
-
129
-
130
-
131
-
132
-
133
-
134
-
135
-
136
-
137
-
138
-
139
-
140
-
141
-
142
-
143
-
144
-
145
-
146
-
147
-
148
-
149
-
150
-
151
-
152
-
153
-
154
-
155
-
156
-
157
-
158
-
159
-
160
-
161
-
162
-
163
-
164
-
165
-
166
-
167
-
168
-
169
-
170
-
171
-
172
-
173
-
174
-
175
-
 176
176 -
 177
177 -
 178
178 -
 179
179 -
 180
180 -
 181
181 -
 182
182 -
 183
183 -
 184
184 -
 185
185 -
 186
186 -
 187
187 -
 188
188 -
 189
189 -
 190
190 -
 191
191 -
 192
192 -
 193
193 -
 194
194 -
 195
195 -
 196
196 -
197
-
198
-
199
-
200
-
201
-
202
-
203
-
204
-
205
-
206
-
207
-
208
-
209
-
210
-
211
-
212
-
213
-
214
-
215
-
216
-
217
-
218
-
219
-
220
-
221
-
222
-
223
-
224
-
225
-
226
-
227
-
228
-
229
-
230
-
231
-
232
-
233
-
234
-
235
-
236
-
237
-
238
-
239
-
240
-
241
-
242
-
243
-
244
-
245
-
246
-
247
-
248
-
249
-
250
 |
 |

40
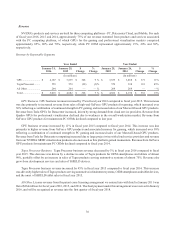
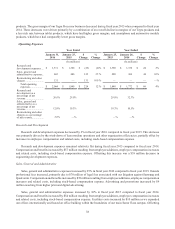
Net other income was $4 million, $14 million and $7 million in fiscal years 2016, 2015 and 2014, respectively. The
decrease for fiscal year 2016 compared to fiscal year 2015 was primarily due to less gain recognized from sales of non-
affiliated investments and more losses from foreign currency remeasurement. The increase for fiscal year 2015 compared
to fiscal year 2014 was primarily due to a gain from the sale of a non-affiliated investment, partially offset by the recognition
of an impairment loss of a non-affiliated investment and losses from foreign currency remeasurement.
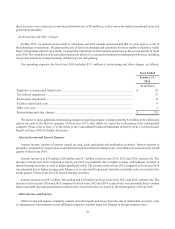
Income Taxes
We recognized income tax expense of $129 million, $124 million and $70 million during fiscal years 2016, 2015 and
2014, respectively. Our annual effective tax rate, was 17.3%, 16.5%, and 13.8% in fiscal years 2016, 2015 and 2014,
respectively. The difference in the effective tax rates amongst the three years was primarily due to an increase in the amount
of earnings subject to United States tax in fiscal years 2016 and 2015, partially offset by a net income tax benefit related to
the Icera modem restructuring in fiscal year 2016, and a higher percentage of research tax credit benefit in fiscal year 2014.
Our effective tax rate for each of the fiscal years was lower than the United States federal statutory rate of 35% primarily
due to income earned in jurisdictions, including British Virgin Islands, Hong Kong, China, Taiwan and United Kingdom,
where the tax rate is lower than the United States federal statutory tax rate of 35%, favorable recognition in these fiscal
years of the U.S. federal research tax credit and favorable discrete events primarily attributable to the tax benefit recognized
upon the expiration of the applicable statutes of limitations.
Please refer to Note 13 of the Notes to the Consolidated Financial Statements in Part IV, Item 15 of this Annual Report
on Form 10-K for additional information.
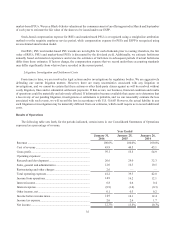
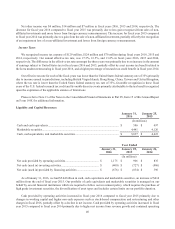
Liquidity and Capital Resources
January 31,
2016
January 25,
2015
(In millions)
Cash and cash equivalents................................................................................................ $ 596 $ 497
Marketable securities........................................................................................................ 4,441 4,126
Cash, cash equivalents, and marketable securities........................................................... $ 5,037 $ 4,623
Year Ended
January 31,
2016
January 25,
2015
January 26,
2014
(In millions)
Net cash provided by operating activities............................................. $ 1,175 $ 906 $ 835
Net cash (used in) investing activities .................................................. $(400)$ (727)$ (806)
Net cash (used in) provided by financing activities.............................. $(676)$ (834) $ 390
As of January 31, 2016, we had $5.04 billion in cash, cash equivalents and marketable securities, an increase of $414
million from the end of fiscal year 2015. Our portfolio of cash equivalents and marketable securities is managed on our
behalf by several financial institutions which are required to follow our investment policy, which requires the purchase of
high grade investment securities, the diversification of asset types and includes certain limits on our portfolio duration.
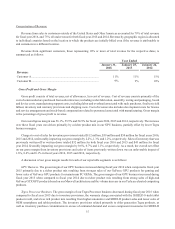
Cash provided by operating activities increased in fiscal year 2016 compared to fiscal year 2015 primarily due to
changes in working capital and higher non-cash expenses such as stock-based compensation and restructuring and other
charges in fiscal 2016, partially offset by a decline in net income. Cash provided by operating activities increased in fiscal
year 2015 compared to fiscal year 2014 primarily due to higher net income from revenue growth and contained operating