NVIDIA 2016 Annual Report Download - page 190
Download and view the complete annual report
Please find page 190 of the 2016 NVIDIA annual report below. You can navigate through the pages in the report by either clicking on the pages listed below, or by using the keyword search tool below to find specific information within the annual report.-
 1
1 -
2
-
3
-
4
-
5
-
6
-
7
-
8
-
9
-
10
-
11
-
12
-
13
-
14
-
15
-
16
-
17
-
18
-
19
-
20
-
21
-
22
-
23
-
24
-
25
-
26
-
27
-
28
-
29
-
30
-
31
-
32
-
33
-
34
-
35
-
36
-
37
-
38
-
39
-
40
-
41
-
42
-
43
-
44
-
45
-
46
-
47
-
48
-
49
-
50
-
51
-
52
-
53
-
54
-
55
-
56
-
57
-
58
-
59
-
60
-
61
-
62
-
63
-
64
-
65
-
66
-
67
-
68
-
69
-
70
-
71
-
72
-
73
-
74
-
75
-
76
-
77
-
78
-
79
-
80
-
81
-
82
-
83
-
84
-
85
-
86
-
87
-
88
-
89
-
90
-
91
-
92
-
93
-
94
-
95
-
96
-
97
-
98
-
99
-
100
-
101
-
102
-
103
-
104
-
105
-
106
-
107
-
108
-
109
-
110
-
111
-
112
-
113
-
114
-
115
-
116
-
117
-
118
-
119
-
120
-
121
-
122
-
123
-
124
-
125
-
126
-
127
-
128
-
129
-
130
-
131
-
132
-
133
-
134
-
135
-
136
-
137
-
138
-
139
-
140
-
141
-
142
-
143
-
144
-
145
-
146
-
147
-
148
-
149
-
150
-
151
-
152
-
153
-
154
-
155
-
156
-
157
-
158
-
159
-
160
-
161
-
162
-
163
-
164
-
165
-
166
-
167
-
168
-
169
-
170
-
171
-
172
-
173
-
174
-
175
-
176
-
177
-
178
-
179
-
 180
180 -
 181
181 -
 182
182 -
 183
183 -
 184
184 -
 185
185 -
 186
186 -
 187
187 -
 188
188 -
 189
189 -
 190
190 -
 191
191 -
 192
192 -
 193
193 -
 194
194 -
 195
195 -
 196
196 -
 197
197 -
 198
198 -
 199
199 -
 200
200 -
201
-
202
-
203
-
204
-
205
-
206
-
207
-
208
-
209
-
210
-
211
-
212
-
213
-
214
-
215
-
216
-
217
-
218
-
219
-
220
-
221
-
222
-
223
-
224
-
225
-
226
-
227
-
228
-
229
-
230
-
231
-
232
-
233
-
234
-
235
-
236
-
237
-
238
-
239
-
240
-
241
-
242
-
243
-
244
-
245
-
246
-
247
-
248
-
249
-
250
 |
 |
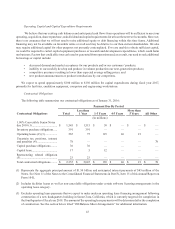
44
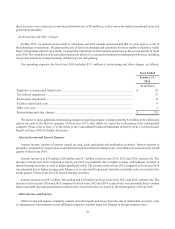
(4) Represents unrecognized tax benefits of $78 million which consists of $67 million plus the related interest and penalties
of $11 million recorded in non-current income tax payable as of January 31, 2016. We are unable to reasonably estimate
the timing of any potential tax liability or interest/penalty payments in individual years due to uncertainties in the
underlying income tax positions and the timing of the effective settlement of such tax positions.
(5) Our operating expenses for the fiscal year 2016 included $131 million of restructuring and other charges related to the
wind-down of our Icera modem operations. The $23 million represents the remaining balance of the restructuring
liability as of January 31, 2016.
Off-Balance Sheet Arrangements
During fiscal year 2016, we began to construct a new headquarters building in Santa Clara, California, which is currently
targeted for completion in the fourth quarter of fiscal year 2018. We are financing this construction under an off-balance
sheet, build-to-suit operating lease arrangement. The banks have committed to fund up to $380 million of costs relating to
construction. Once construction is complete, the lease balance will remain static at the completed cost for the remaining
duration of the lease term. During construction, accrued interest will be capitalized into the lease balance. Following
construction, we will pay rent in the form of interest. The lease has an initial 7.5 year term expiring on December 19, 2022,
consisting of an approximately 2.5 year construction period followed by a 5 year lease term. We have the option to renew
this lease for up to three additional 5 year periods, subject to approval by the banks. During the term of the lease, we may
elect to purchase the headquarters building for the amount of the banks’ investment in the building and any accrued but
unpaid rent. At the end of the lease term, we may elect to buy the building for the outstanding balance on the maturity date
or arrange for the cash sale of the building to an unaffiliated third party. The aggregate guarantee made by us under the lease
is no more than 87.5% of the costs incurred in connection with the construction of the building. Please refer to Note 12 of
the Notes to the Consolidated Financial Statements in Part IV, Item 15 of this Annual Report on Form 10-K for further
discussion regarding our operating lease financing arrangement.
During fiscal years 2015 and 2014, we had no material off-balance sheet arrangements as defined in Regulation S-K
303(a)(4)(ii).
Adoption of New and Recently Issued Accounting Pronouncements
Please see Note 1 of the Notes to the Consolidated Financial Statements in Part IV, Item 15 of this Annual Report on
Form 10-K for a discussion of adoption of new and recently issued accounting pronouncements.
ITEM 7A. QUANTITATIVE AND QUALITATIVE DISCLOSURES ABOUT MARKET RISK
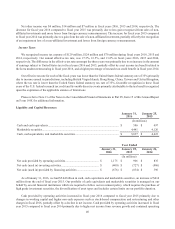
Investment and Interest Rate Risk
As of January 31, 2016 and January 25, 2015, we had $5.04 billion and $4.62 billion, respectively, in cash, cash
equivalents and marketable securities. As of January 31, 2016, we did not have any investments in auction-rate preferred
securities.
As of January 31, 2016, we performed a sensitivity analysis on our floating and fixed rate financial investments.
According to our analysis, parallel shifts in the yield curve of both plus or minus 0.5% would result in changes in fair values
for these investments of $28 million.
Investments in both fixed and floating rate interest earning instruments carry a degree of interest rate risk. Fixed rate
debt securities may have their market value adversely impacted due to a rise in interest rates, while floating rate securities
may produce less income than expected if interest rates fall. Due in part to these factors, our future investment income may
fall short of expectations due to changes in interest rates or if the decline in fair value of our publicly traded debt or equity
investments is judged to be other-than-temporary. We may suffer losses in principal if we are forced to sell securities that
decline in market value due to changes in interest rates. However, because any debt securities we hold are classified as