NVIDIA 2016 Annual Report Download - page 173
Download and view the complete annual report
Please find page 173 of the 2016 NVIDIA annual report below. You can navigate through the pages in the report by either clicking on the pages listed below, or by using the keyword search tool below to find specific information within the annual report.-
 1
1 -
2
-
3
-
4
-
5
-
6
-
7
-
8
-
9
-
10
-
11
-
12
-
13
-
14
-
15
-
16
-
17
-
18
-
19
-
20
-
21
-
22
-
23
-
24
-
25
-
26
-
27
-
28
-
29
-
30
-
31
-
32
-
33
-
34
-
35
-
36
-
37
-
38
-
39
-
40
-
41
-
42
-
43
-
44
-
45
-
46
-
47
-
48
-
49
-
50
-
51
-
52
-
53
-
54
-
55
-
56
-
57
-
58
-
59
-
60
-
61
-
62
-
63
-
64
-
65
-
66
-
67
-
68
-
69
-
70
-
71
-
72
-
73
-
74
-
75
-
76
-
77
-
78
-
79
-
80
-
81
-
82
-
83
-
84
-
85
-
86
-
87
-
88
-
89
-
90
-
91
-
92
-
93
-
94
-
95
-
96
-
97
-
98
-
99
-
100
-
101
-
102
-
103
-
104
-
105
-
106
-
107
-
108
-
109
-
110
-
111
-
112
-
113
-
114
-
115
-
116
-
117
-
118
-
119
-
120
-
121
-
122
-
123
-
124
-
125
-
126
-
127
-
128
-
129
-
130
-
131
-
132
-
133
-
134
-
135
-
136
-
137
-
138
-
139
-
140
-
141
-
142
-
143
-
144
-
145
-
146
-
147
-
148
-
149
-
150
-
151
-
152
-
153
-
154
-
155
-
156
-
157
-
158
-
159
-
160
-
161
-
162
-
 163
163 -
 164
164 -
 165
165 -
 166
166 -
 167
167 -
 168
168 -
 169
169 -
 170
170 -
 171
171 -
 172
172 -
 173
173 -
 174
174 -
 175
175 -
 176
176 -
 177
177 -
 178
178 -
 179
179 -
 180
180 -
 181
181 -
 182
182 -
 183
183 -
184
-
185
-
186
-
187
-
188
-
189
-
190
-
191
-
192
-
193
-
194
-
195
-
196
-
197
-
198
-
199
-
200
-
201
-
202
-
203
-
204
-
205
-
206
-
207
-
208
-
209
-
210
-
211
-
212
-
213
-
214
-
215
-
216
-
217
-
218
-
219
-
220
-
221
-
222
-
223
-
224
-
225
-
226
-
227
-
228
-
229
-
230
-
231
-
232
-
233
-
234
-
235
-
236
-
237
-
238
-
239
-
240
-
241
-
242
-
243
-
244
-
245
-
246
-
247
-
248
-
249
-
250
 |
 |

27
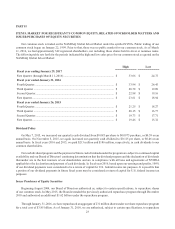
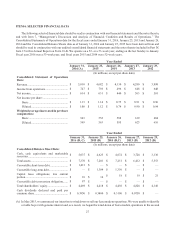
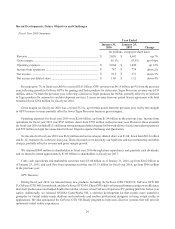
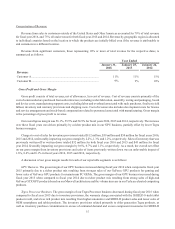
ITEM 6. SELECTED FINANCIAL DATA
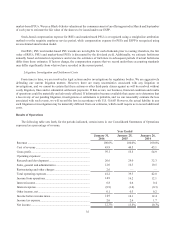
The following selected financial data should be read in conjunction with our financial statements and the notes thereto,
and with Item 7, “Management’s Discussion and Analysis of Financial Condition and Results of Operations.” The
Consolidated Statements of Operations data for the fiscal years ended January 31, 2016, January 25, 2015 and January 26,
2014 and the Consolidated Balance Sheets data as of January 31, 2016 and January 25, 2015 have been derived from and
should be read in conjunction with our audited consolidated financial statements and the notes thereto included in Part IV,
Item 15 in this Annual Report on Form 10-K. We operate on a 52- or a 53-week year, ending on the last Sunday in January.
Fiscal year 2016 was a 53-week year, and fiscal years 2015 and 2014 were 52-week years.
Year Ended
January 31,
2016 (A)
January 25,
2015
January 26,
2014
January 27,
2013
January 29,
2012
(In millions, except per share data)
Consolidated Statement of Operations
Data:
Revenue ....................................................... $ 5,010 $ 4,682 $ 4,130 $ 4,280 $ 3,998
Income from operations............................... $ 747 $ 759 $ 496 $ 648 $ 648
Net income................................................... $ 614 $ 631 $ 440 $ 563 $ 581
Net income per share:..................................
Basic ..................................................... $ 1.13 $ 1.14 $ 0.75 $ 0.91 $ 0.96
Diluted.................................................. $ 1.08 $ 1.12 $ 0.74 $ 0.90 $ 0.94
Weighted average shares used in per share
computation:
Basic ..................................................... 543 552 588 619 604
Diluted.................................................. 569 563 595 625 616
Year Ended
January 31,
2016 (B, C)
January 25,
2015 (B)
January 26,
2014 (B,C)
January 27,
2013 (B)
January 29,
2012 (D)
(In millions, except per share data)
Consolidated Balance Sheet Data:
Cash, cash equivalents and marketable
securities ...................................................... $ 5,037 $ 4,623 $ 4,672 $ 3,728 $ 3,130
Total assets................................................... $ 7,370 $ 7,201 $ 7,251 $ 6,412 $ 5,553
Convertible short-term debt......................... $ 1,413 $ — $ — $ — $ —
Convertible long-term debt.......................... $ — $ 1,384 $ 1,356 $ — $ —
Capital lease obligations, less current
portion.......................................................... $10$14
$ 18 $ 19 $ 21
Convertible debt conversion obligation....... $87
$—$—$—$—
Total shareholders’ equity............................ $ 4,469 $ 4,418 $ 4,456 $ 4,828 $ 4,146
Cash dividends declared and paid per
common share.............................................. $ 0.3950 $ 0.3400 $ 0.3100 $ 0.0750 $ —
(A) In May 2015, we announced our intention to wind down or sell our Icera modem operations. We were unable to identify
a viable buyer with genuine interest and, as a result, we began the wind-down of Icera modem operations in the second