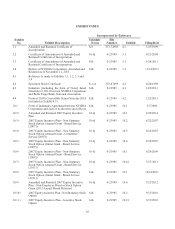
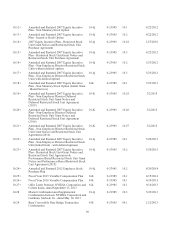
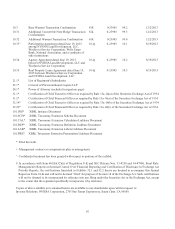
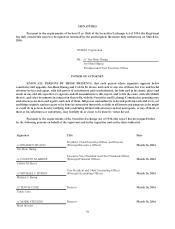
NVIDIA 2016 Annual Report Download - page 235
Download and view the complete annual report
Please find page 235 of the 2016 NVIDIA annual report below. You can navigate through the pages in the report by either clicking on the pages listed below, or by using the keyword search tool below to find specific information within the annual report.-
 1
1 -
2
-
3
-
4
-
5
-
6
-
7
-
8
-
9
-
10
-
11
-
12
-
13
-
14
-
15
-
16
-
17
-
18
-
19
-
20
-
21
-
22
-
23
-
24
-
25
-
26
-
27
-
28
-
29
-
30
-
31
-
32
-
33
-
34
-
35
-
36
-
37
-
38
-
39
-
40
-
41
-
42
-
43
-
44
-
45
-
46
-
47
-
48
-
49
-
50
-
51
-
52
-
53
-
54
-
55
-
56
-
57
-
58
-
59
-
60
-
61
-
62
-
63
-
64
-
65
-
66
-
67
-
68
-
69
-
70
-
71
-
72
-
73
-
74
-
75
-
76
-
77
-
78
-
79
-
80
-
81
-
82
-
83
-
84
-
85
-
86
-
87
-
88
-
89
-
90
-
91
-
92
-
93
-
94
-
95
-
96
-
97
-
98
-
99
-
100
-
101
-
102
-
103
-
104
-
105
-
106
-
107
-
108
-
109
-
110
-
111
-
112
-
113
-
114
-
115
-
116
-
117
-
118
-
119
-
120
-
121
-
122
-
123
-
124
-
125
-
126
-
127
-
128
-
129
-
130
-
131
-
132
-
133
-
134
-
135
-
136
-
137
-
138
-
139
-
140
-
141
-
142
-
143
-
144
-
145
-
146
-
147
-
148
-
149
-
150
-
151
-
152
-
153
-
154
-
155
-
156
-
157
-
158
-
159
-
160
-
161
-
162
-
163
-
164
-
165
-
166
-
167
-
168
-
169
-
170
-
171
-
172
-
173
-
174
-
175
-
176
-
177
-
178
-
179
-
180
-
181
-
182
-
183
-
184
-
185
-
186
-
187
-
188
-
189
-
190
-
191
-
192
-
193
-
194
-
195
-
196
-
197
-
198
-
199
-
200
-
201
-
202
-
203
-
204
-
205
-
206
-
207
-
208
-
209
-
210
-
211
-
212
-
213
-
214
-
215
-
216
-
217
-
218
-
219
-
220
-
221
-
222
-
223
-
224
-
 225
225 -
 226
226 -
 227
227 -
 228
228 -
 229
229 -
 230
230 -
 231
231 -
 232
232 -
 233
233 -
 234
234 -
 235
235 -
 236
236 -
 237
237 -
 238
238 -
 239
239 -
 240
240 -
 241
241 -
 242
242 -
 243
243 -
 244
244 -
 245
245 -
246
-
247
-
248
-
249
-
250
 |
 |

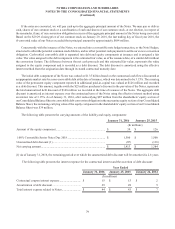
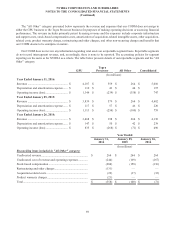
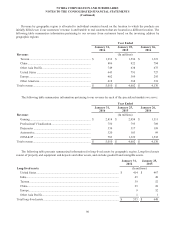
NVIDIA CORPORATION AND SUBSIDIARIES
NOTES TO THE CONSOLIDATED FINANCIAL STATEMENTS
(Continued)
89
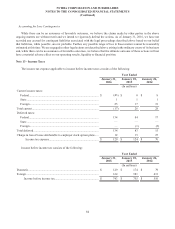
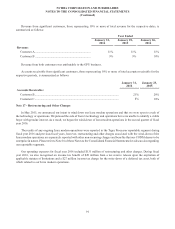
The “All Other” category presented below represents the revenue and expenses that our CODM does not assign to
either the GPU business or the Tegra Processor business for purposes of making operating decisions or assessing financial
performance. The revenue includes primarily patent licensing revenue and the expenses include corporate infrastructure
and support costs, stock-based compensation costs, amortization of acquisition-related intangible assets, other acquisition-
related costs, product warranty charge, restructuring and other charges, and other non-recurring charges and benefits that
our CODM deems to be enterprise in nature.
Our CODM does not review any information regarding total assets on a reportable segment basis. Reportable segments
do not record intersegment revenue, and, accordingly, there is none to be reported. The accounting policies for segment
reporting are the same as for NVIDIA as a whole. The table below presents details of our reportable segments and the “All
Other” category.
GPU
Tegra
Processor All Other Consolidated
(In millions)
Year Ended January 31, 2016:
Revenue ...................................................... $ 4,187 $ 559 $ 264 $ 5,010
Depreciation and amortization expense...... $ 110 $ 43 $ 44 $ 197
Operating income (loss).............................. $ 1,344 $ (239)$ (358) $ 747
Year Ended January 25, 2015:
Revenue ...................................................... $ 3,839 $ 579 $ 264 $ 4,682
Depreciation and amortization expense...... $ 117 $ 57 $ 46 $ 220
Operating income (loss).............................. $ 1,113 $ (254)$ (100) $ 759
Year Ended January 26, 2014:
Revenue ...................................................... $ 3,468 $ 398 $ 264 $ 4,130
Depreciation and amortization expense...... $ 147 $ 50 $ 42 $ 239
Operating income (loss).............................. $ 835 $ (268)$ (71) $ 496
Year Ended
January 31,
2016
January 25,
2015
January 26,
2014
(In millions)
Reconciling items included in "All Other" category:
Unallocated revenue............................................................... $ 264 $ 264 $ 264
Unallocated cost of revenue and operating expenses............. (244)(169)(167)
Stock-based compensation ..................................................... (204)(158)(136)
Restructuring and other charges............................................. (131)— —
Acquisition-related costs ........................................................ (22)(37)(32)
Product warranty charges ....................................................... (21)— —
Total........................................................................................ $(358)$ (100)$ (71)