NVIDIA 2016 Annual Report Download - page 197
Download and view the complete annual report
Please find page 197 of the 2016 NVIDIA annual report below. You can navigate through the pages in the report by either clicking on the pages listed below, or by using the keyword search tool below to find specific information within the annual report.-
 1
1 -
2
-
3
-
4
-
5
-
6
-
7
-
8
-
9
-
10
-
11
-
12
-
13
-
14
-
15
-
16
-
17
-
18
-
19
-
20
-
21
-
22
-
23
-
24
-
25
-
26
-
27
-
28
-
29
-
30
-
31
-
32
-
33
-
34
-
35
-
36
-
37
-
38
-
39
-
40
-
41
-
42
-
43
-
44
-
45
-
46
-
47
-
48
-
49
-
50
-
51
-
52
-
53
-
54
-
55
-
56
-
57
-
58
-
59
-
60
-
61
-
62
-
63
-
64
-
65
-
66
-
67
-
68
-
69
-
70
-
71
-
72
-
73
-
74
-
75
-
76
-
77
-
78
-
79
-
80
-
81
-
82
-
83
-
84
-
85
-
86
-
87
-
88
-
89
-
90
-
91
-
92
-
93
-
94
-
95
-
96
-
97
-
98
-
99
-
100
-
101
-
102
-
103
-
104
-
105
-
106
-
107
-
108
-
109
-
110
-
111
-
112
-
113
-
114
-
115
-
116
-
117
-
118
-
119
-
120
-
121
-
122
-
123
-
124
-
125
-
126
-
127
-
128
-
129
-
130
-
131
-
132
-
133
-
134
-
135
-
136
-
137
-
138
-
139
-
140
-
141
-
142
-
143
-
144
-
145
-
146
-
147
-
148
-
149
-
150
-
151
-
152
-
153
-
154
-
155
-
156
-
157
-
158
-
159
-
160
-
161
-
162
-
163
-
164
-
165
-
166
-
167
-
168
-
169
-
170
-
171
-
172
-
173
-
174
-
175
-
176
-
177
-
178
-
179
-
180
-
181
-
182
-
183
-
184
-
185
-
186
-
 187
187 -
 188
188 -
 189
189 -
 190
190 -
 191
191 -
 192
192 -
 193
193 -
 194
194 -
 195
195 -
 196
196 -
 197
197 -
 198
198 -
 199
199 -
 200
200 -
 201
201 -
 202
202 -
 203
203 -
 204
204 -
 205
205 -
 206
206 -
 207
207 -
208
-
209
-
210
-
211
-
212
-
213
-
214
-
215
-
216
-
217
-
218
-
219
-
220
-
221
-
222
-
223
-
224
-
225
-
226
-
227
-
228
-
229
-
230
-
231
-
232
-
233
-
234
-
235
-
236
-
237
-
238
-
239
-
240
-
241
-
242
-
243
-
244
-
245
-
246
-
247
-
248
-
249
-
250
 |
 |

51
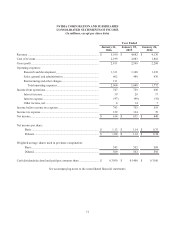
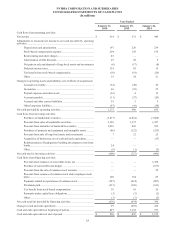
NVIDIA CORPORATION AND SUBSIDIARIES
CONSOLIDATED STATEMENTS OF INCOME
(In millions, except per share data)
Year Ended
January 31,
2016
January 25,
2015
January 26,
2014
Revenue ................................................................................................ $ 5,010 $ 4,682 $ 4,130
Cost of revenue ..................................................................................... 2,199 2,083 1,862
Gross profit ........................................................................................... 2,811 2,599 2,268
Operating expenses:
Research and development.......................................................... 1,331 1,360 1,336
Sales, general and administrative................................................ 602 480 436
Restructuring and other charges.................................................. 131——
Total operating expenses........................................................ 2,064 1,840 1,772
Income from operations........................................................................ 747 759 496
Interest income............................................................................ 39 28 17
Interest expense........................................................................... (47)(46)(10)
Other income, net........................................................................ 414 7
Income before income tax expense....................................................... 743 755 510
Income tax expense............................................................................... 129 124 70
Net income............................................................................................ $ 614 $ 631 $ 440
Net income per share:
Basic........................................................................................... $ 1.13 $ 1.14 $ 0.75
Diluted........................................................................................ $ 1.08 $ 1.12 $ 0.74
Weighted average shares used in per share computation:
Basic........................................................................................... 543 552 588
Diluted........................................................................................ 569 563 595
Cash dividends declared and paid per common share .......................... $ 0.3950 $ 0.3400 $ 0.3100
See accompanying notes to the consolidated financial statements.