NVIDIA 2016 Annual Report Download - page 179
Download and view the complete annual report
Please find page 179 of the 2016 NVIDIA annual report below. You can navigate through the pages in the report by either clicking on the pages listed below, or by using the keyword search tool below to find specific information within the annual report.-
 1
1 -
2
-
3
-
4
-
5
-
6
-
7
-
8
-
9
-
10
-
11
-
12
-
13
-
14
-
15
-
16
-
17
-
18
-
19
-
20
-
21
-
22
-
23
-
24
-
25
-
26
-
27
-
28
-
29
-
30
-
31
-
32
-
33
-
34
-
35
-
36
-
37
-
38
-
39
-
40
-
41
-
42
-
43
-
44
-
45
-
46
-
47
-
48
-
49
-
50
-
51
-
52
-
53
-
54
-
55
-
56
-
57
-
58
-
59
-
60
-
61
-
62
-
63
-
64
-
65
-
66
-
67
-
68
-
69
-
70
-
71
-
72
-
73
-
74
-
75
-
76
-
77
-
78
-
79
-
80
-
81
-
82
-
83
-
84
-
85
-
86
-
87
-
88
-
89
-
90
-
91
-
92
-
93
-
94
-
95
-
96
-
97
-
98
-
99
-
100
-
101
-
102
-
103
-
104
-
105
-
106
-
107
-
108
-
109
-
110
-
111
-
112
-
113
-
114
-
115
-
116
-
117
-
118
-
119
-
120
-
121
-
122
-
123
-
124
-
125
-
126
-
127
-
128
-
129
-
130
-
131
-
132
-
133
-
134
-
135
-
136
-
137
-
138
-
139
-
140
-
141
-
142
-
143
-
144
-
145
-
146
-
147
-
148
-
149
-
150
-
151
-
152
-
153
-
154
-
155
-
156
-
157
-
158
-
159
-
160
-
161
-
162
-
163
-
164
-
165
-
166
-
167
-
168
-
 169
169 -
 170
170 -
 171
171 -
 172
172 -
 173
173 -
 174
174 -
 175
175 -
 176
176 -
 177
177 -
 178
178 -
 179
179 -
 180
180 -
 181
181 -
 182
182 -
 183
183 -
 184
184 -
 185
185 -
 186
186 -
 187
187 -
 188
188 -
 189
189 -
190
-
191
-
192
-
193
-
194
-
195
-
196
-
197
-
198
-
199
-
200
-
201
-
202
-
203
-
204
-
205
-
206
-
207
-
208
-
209
-
210
-
211
-
212
-
213
-
214
-
215
-
216
-
217
-
218
-
219
-
220
-
221
-
222
-
223
-
224
-
225
-
226
-
227
-
228
-
229
-
230
-
231
-
232
-
233
-
234
-
235
-
236
-
237
-
238
-
239
-
240
-
241
-
242
-
243
-
244
-
245
-
246
-
247
-
248
-
249
-
250
 |
 |
33
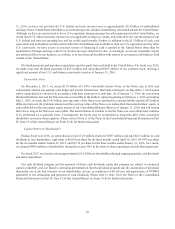
As of January 31, 2016, we had a valuation allowance of $272 million related to state and certain foreign deferred tax
assets that management determined are not likely to be realized due, in part, to projections of future taxable income and
potential utilization limitations of tax attributes acquired as a result of stock ownership changes. To the extent realization
of the deferred tax assets becomes more-likely-than-not, we would recognize such deferred tax asset as an income tax benefit
during the period.
Goodwill
Goodwill is subject to our annual impairment test during the fourth quarter of our fiscal year, or earlier if indicators of
potential impairment exist, using either a qualitative or a quantitative assessment. Our impairment review process compares
the fair value of the reporting unit in which the goodwill resides to its carrying value. We have identified two reporting
units, GPU and Tegra Processor, for the purposes of completing our goodwill analysis. Goodwill assigned to these reporting
units as of January 31, 2016 was $210 million and $408 million, respectively. Determining the number of reporting units
and the fair value of a reporting unit requires us to make judgments and involves the use of significant estimates and
assumptions. We also make judgments and assumptions in allocating assets and liabilities to each of our reporting units.
We base our fair value estimates on assumptions we believe to be reasonable but that are unpredictable and inherently
uncertain.
During the fourth quarter of fiscal year 2016, we elected to use the quantitative assessment to test goodwill for impairment
for each reporting unit. In applying the fair value based test of each reporting unit, the results from the income approach
and the market approach were equally weighted. These valuation approaches consider a number of factors that include, but
are not limited to, prospective financial information, growth rates, terminal or residual values, discount rates and comparable
multiples from publicly traded companies in our industry and require us to make certain assumptions and estimates regarding
industry economic factors and the future profitability of our business.
When performing an income approach valuation, we incorporate the use of projected financial information and a
discount rate that are developed using market participant based assumptions to our discounted cash flow model. Our estimates
of discounted cash flow were based upon, among other things, certain assumptions about our expected future operating
performance, such as revenue growth rates, operating margins, risk-adjusted discount rates, and future economic and market
conditions. Our estimates may differ from actual cash flow due to, among other things, economic conditions, changes to
our business model or changes in operating performance. Additionally, certain estimates of discounted cash flow involve
businesses with limited financial history and developing revenue models, which increases the risk of differences between
the projected and actual performance. The long-term financial forecasts that we utilize represent the best estimate that we
have at this time and we believe that its underlying assumptions are reasonable. Significant differences between our estimates
and actual cash flow could materially affect our future financial results, which could impact our future estimates of the fair
value of our reporting units.
During the fourth quarter of fiscal year 2016, we concluded that there was no impairment of our goodwill. The fair
values of our GPU and Tegra Processor reporting units significantly exceeded their respective carrying values. As such,
even the application of a hypothetical 10% decrease to the fair value of each reporting unit would not have resulted in the
fair value of either reporting unit being less than its carrying value. As an overall test of the reasonableness of estimated
fair values of our reporting units, we reconciled the combined fair value estimates of our reporting units to our market
capitalization as of the valuation date. The reconciliation confirmed that the fair values were relatively representative of the
market views when applying a reasonable control premium to the market capitalization. However, any significant reductions
in the actual amount of future cash flows realized by our reporting units, reductions in the value of market comparables, or
reductions in our market capitalization could impact future estimates of the fair values of our reporting units. Such events
could ultimately result in a charge to our earnings in future periods due to the potential for a write-down of the goodwill
associated with our reporting units.
Our next annual evaluation of the goodwill by reporting unit will be performed during the fourth quarter of fiscal year
2017, or earlier if indicators of potential impairment exist. Such indicators include, but are not limited to, challenging
economic conditions, such as a decline in our operating results, an unfavorable industry or macroeconomic environment,