NVIDIA 2016 Annual Report Download - page 184
Download and view the complete annual report
Please find page 184 of the 2016 NVIDIA annual report below. You can navigate through the pages in the report by either clicking on the pages listed below, or by using the keyword search tool below to find specific information within the annual report.-
 1
1 -
2
-
3
-
4
-
5
-
6
-
7
-
8
-
9
-
10
-
11
-
12
-
13
-
14
-
15
-
16
-
17
-
18
-
19
-
20
-
21
-
22
-
23
-
24
-
25
-
26
-
27
-
28
-
29
-
30
-
31
-
32
-
33
-
34
-
35
-
36
-
37
-
38
-
39
-
40
-
41
-
42
-
43
-
44
-
45
-
46
-
47
-
48
-
49
-
50
-
51
-
52
-
53
-
54
-
55
-
56
-
57
-
58
-
59
-
60
-
61
-
62
-
63
-
64
-
65
-
66
-
67
-
68
-
69
-
70
-
71
-
72
-
73
-
74
-
75
-
76
-
77
-
78
-
79
-
80
-
81
-
82
-
83
-
84
-
85
-
86
-
87
-
88
-
89
-
90
-
91
-
92
-
93
-
94
-
95
-
96
-
97
-
98
-
99
-
100
-
101
-
102
-
103
-
104
-
105
-
106
-
107
-
108
-
109
-
110
-
111
-
112
-
113
-
114
-
115
-
116
-
117
-
118
-
119
-
120
-
121
-
122
-
123
-
124
-
125
-
126
-
127
-
128
-
129
-
130
-
131
-
132
-
133
-
134
-
135
-
136
-
137
-
138
-
139
-
140
-
141
-
142
-
143
-
144
-
145
-
146
-
147
-
148
-
149
-
150
-
151
-
152
-
153
-
154
-
155
-
156
-
157
-
158
-
159
-
160
-
161
-
162
-
163
-
164
-
165
-
166
-
167
-
168
-
169
-
170
-
171
-
172
-
173
-
 174
174 -
 175
175 -
 176
176 -
 177
177 -
 178
178 -
 179
179 -
 180
180 -
 181
181 -
 182
182 -
 183
183 -
 184
184 -
 185
185 -
 186
186 -
 187
187 -
 188
188 -
 189
189 -
 190
190 -
 191
191 -
 192
192 -
 193
193 -
 194
194 -
195
-
196
-
197
-
198
-
199
-
200
-
201
-
202
-
203
-
204
-
205
-
206
-
207
-
208
-
209
-
210
-
211
-
212
-
213
-
214
-
215
-
216
-
217
-
218
-
219
-
220
-
221
-
222
-
223
-
224
-
225
-
226
-
227
-
228
-
229
-
230
-
231
-
232
-
233
-
234
-
235
-
236
-
237
-
238
-
239
-
240
-
241
-
242
-
243
-
244
-
245
-
246
-
247
-
248
-
249
-
250
 |
 |

38
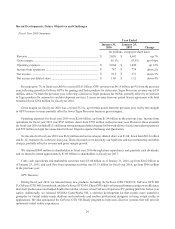
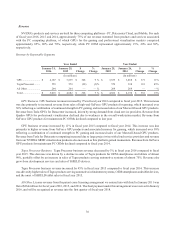
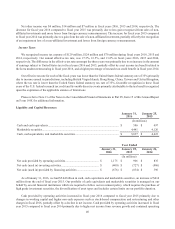
products. The gross margin of our Tegra Processor business decreased during fiscal year 2015 when compared to fiscal year
2014. These decreases were driven primarily by a combination of an overall decline in margins of our Tegra products and
a less rich mix between tablet products, which have had higher gross margins, and smartphone and automotive module
products, which have had comparably lower gross margins.
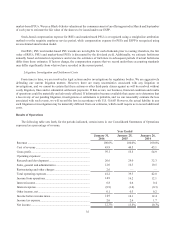
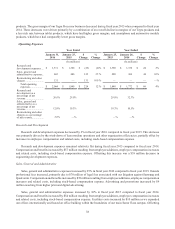
Operating Expenses
Year Ended Year Ended
January 31,
2016
January 25,
2015
$
Change
%
Change
January 25,
2015
January 26,
2014
$
Change
%
Change
(In millions) (In millions)
Research and
development expenses .... $ 1,331 $ 1,360 $ (29) (2)% $ 1,360 $ 1,336 $ 24 2%
Sales, general and
administrative expenses .. 602 480 122 25 % 480 436 44 10%
Restructuring and other
charges ............................ 131 — 131 100 % — — — —%
Total operating
expenses..................... $ 2,064 $ 1,840 $ 224 12 % $ 1,840 $ 1,772 $ 68 4%
Research and
development as a
percentage of net
revenue............................ 26.6% 29.0% 29.0% 32.3%
Sales, general and
administrative as a
percentage of net
revenue............................ 12.0% 10.3% 10.3% 10.5%
Restructuring and other
charges as a percentage
of net revenue.................. 2.6% —% —% —%
Research and Development
Research and development expenses decreased by 2% in fiscal year 2016 compared to fiscal year 2015. This decrease
was primarily driven by the wind-down of Icera modem operations and other organization efficiencies, partially offset by
increases in employee compensation and related costs, including stock-based compensation expense.
Research and development expenses remained relatively flat during fiscal year 2015 compared to fiscal year 2014.
Compensation and benefits increased by $57 million resulting from employee additions, employee compensation increases
and related costs, including stock-based compensation expense. Offsetting this increase was a $39 million decrease in
engineering development expenses.
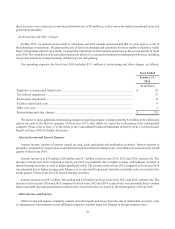
Sales, General and Administrative
Sales, general and administrative expenses increased by 25% in fiscal year 2016 compared to fiscal year 2015. Outside
professional fees increased, primarily due to $70 million of legal fees associated with our litigation against Samsung and
Qualcomm. Compensation and benefits increased by $39 million resulting from employee additions, employee compensation
increases and related costs, including stock-based compensation expense. Advertising and promotions increased by $9
million resulting from higher print and digital advertising.
Sales, general and administrative expenses increased by 10% in fiscal year 2015 compared to fiscal year 2014.
Compensation and benefits increased by $54 million resulting from employee additions, employee compensation increases
and related costs, including stock-based compensation expense. Facilities costs increased by $10 million as we expanded
our offices internationally and leased an office building within the boundaries of our main Santa Clara campus. Offsetting