NVIDIA 2016 Annual Report Download - page 214
Download and view the complete annual report
Please find page 214 of the 2016 NVIDIA annual report below. You can navigate through the pages in the report by either clicking on the pages listed below, or by using the keyword search tool below to find specific information within the annual report.-
 1
1 -
2
-
3
-
4
-
5
-
6
-
7
-
8
-
9
-
10
-
11
-
12
-
13
-
14
-
15
-
16
-
17
-
18
-
19
-
20
-
21
-
22
-
23
-
24
-
25
-
26
-
27
-
28
-
29
-
30
-
31
-
32
-
33
-
34
-
35
-
36
-
37
-
38
-
39
-
40
-
41
-
42
-
43
-
44
-
45
-
46
-
47
-
48
-
49
-
50
-
51
-
52
-
53
-
54
-
55
-
56
-
57
-
58
-
59
-
60
-
61
-
62
-
63
-
64
-
65
-
66
-
67
-
68
-
69
-
70
-
71
-
72
-
73
-
74
-
75
-
76
-
77
-
78
-
79
-
80
-
81
-
82
-
83
-
84
-
85
-
86
-
87
-
88
-
89
-
90
-
91
-
92
-
93
-
94
-
95
-
96
-
97
-
98
-
99
-
100
-
101
-
102
-
103
-
104
-
105
-
106
-
107
-
108
-
109
-
110
-
111
-
112
-
113
-
114
-
115
-
116
-
117
-
118
-
119
-
120
-
121
-
122
-
123
-
124
-
125
-
126
-
127
-
128
-
129
-
130
-
131
-
132
-
133
-
134
-
135
-
136
-
137
-
138
-
139
-
140
-
141
-
142
-
143
-
144
-
145
-
146
-
147
-
148
-
149
-
150
-
151
-
152
-
153
-
154
-
155
-
156
-
157
-
158
-
159
-
160
-
161
-
162
-
163
-
164
-
165
-
166
-
167
-
168
-
169
-
170
-
171
-
172
-
173
-
174
-
175
-
176
-
177
-
178
-
179
-
180
-
181
-
182
-
183
-
184
-
185
-
186
-
187
-
188
-
189
-
190
-
191
-
192
-
193
-
194
-
195
-
196
-
197
-
198
-
199
-
200
-
201
-
202
-
203
-
 204
204 -
 205
205 -
 206
206 -
 207
207 -
 208
208 -
 209
209 -
 210
210 -
 211
211 -
 212
212 -
 213
213 -
 214
214 -
 215
215 -
 216
216 -
 217
217 -
 218
218 -
 219
219 -
 220
220 -
 221
221 -
 222
222 -
 223
223 -
 224
224 -
225
-
226
-
227
-
228
-
229
-
230
-
231
-
232
-
233
-
234
-
235
-
236
-
237
-
238
-
239
-
240
-
241
-
242
-
243
-
244
-
245
-
246
-
247
-
248
-
249
-
250
 |
 |

NVIDIA CORPORATION AND SUBSIDIARIES
NOTES TO THE CONSOLIDATED FINANCIAL STATEMENTS
(Continued)
68
Employees are eligible to participate if they are employed by us or an affiliate of us as designated by the Board.
Employees who participate in an offering may have up to 10% of their earnings withheld up to certain limitations and
applied on specified dates determined by the Board to the purchase of shares of common stock. The Board may increase
this percentage at its discretion, up to 15%. The price of common stock purchased under our ESPP will be equal to 85% of
the lower of the fair market value of the common stock on the commencement date of each offering period and the purchase
date of each offering period. Employees may end their participation in the ESPP at any time during the offering period, and
participation ends automatically on termination of employment with us. In each case, the employee’s contributions are
refunded.
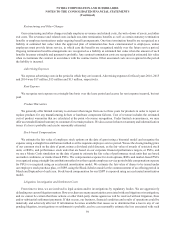
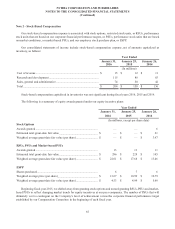
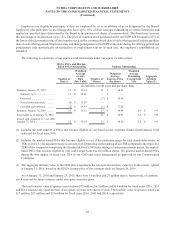
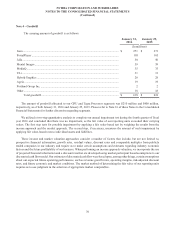
The following is a summary of our equity award transactions under our equity incentive plans:
RSUs, PSUs and Market-
based PSUs Outstanding Options Outstanding
Number of
Shares
Weighted
Average
Grant-
Date
Fair Value
Number of
Shares
Weighted
Average
Exercise Price
Per Share
Weighted
Average
Remaining
Contractual
Life
Aggregate
Intrinsic
Value (3)
(In millions, except years and per share data)
Balances, January 25, 2015 23 $ 15.94 21 $ 14.61
Granted (1)(2)............................. 13 $ 22.01 — $ —
Exercised .................................... — — (7) $ 14.60
Vested restricted stock................ (8) $ 15.56 — —
Canceled and forfeited................ (2) $ 16.63 (1) $ 17.28
Balances, January 31, 2016 ............. 26 $ 19.12 13 $ 14.49 5.9 $ 197
Exercisable as of January 31, 2016 11 $ 14.51 5.6 $ 159
Vested and expected to vest after
January 31, 2016.............................. 22 $ 19.14 13 $ 14.50 5.8 $ 191
(1) Includes the total number of PSUs that became eligible to vest based on the corporate financial performance level
achieved for fiscal year 2016.
(2) Includes the market-based PSUs that become eligible to vest if the maximum target for total shareholder return, or
TSR, over the 3-year measurement period is achieved. Depending on the ranking of our TSR compared to the respective
TSRs of the companies comprising the Standard & Poor’s 500 Index during a 3-year measurement period, the market-
based PSUs that become eligible to vest could range from 0 to 0.4 million shares. We granted market-based PSUs
during the first quarter of fiscal year 2016 to our CEO and senior management as approved by our Compensation
Committee.
(3) The aggregate intrinsic value in the table above represents the total pre-tax intrinsic value for in-the-money options
at January 31, 2016, based on the $29.29 closing price of our common stock on January 29, 2016.
As of January 31, 2016 and January 25, 2015, there were 14 million and 25 million shares, respectively, of common
stock reserved for future issuance under our equity incentive plans.
The total intrinsic value of options exercised was $75 million, $62 million and $14 million for fiscal years 2016, 2015
and 2014, respectively. Upon exercise of an option, we issue new shares of stock. The total fair value of options vested was
$17 million, $33 million and $35 million for fiscal years 2016, 2015 and 2014, respectively.