NVIDIA 2016 Annual Report Download - page 60
Download and view the complete annual report
Please find page 60 of the 2016 NVIDIA annual report below. You can navigate through the pages in the report by either clicking on the pages listed below, or by using the keyword search tool below to find specific information within the annual report.-
 1
1 -
2
-
3
-
4
-
5
-
6
-
7
-
8
-
9
-
10
-
11
-
12
-
13
-
14
-
15
-
16
-
17
-
18
-
19
-
20
-
21
-
22
-
23
-
24
-
25
-
26
-
27
-
28
-
29
-
30
-
31
-
32
-
33
-
34
-
35
-
36
-
37
-
38
-
39
-
40
-
41
-
42
-
43
-
44
-
45
-
46
-
47
-
48
-
49
-
 50
50 -
 51
51 -
 52
52 -
 53
53 -
 54
54 -
 55
55 -
 56
56 -
 57
57 -
 58
58 -
 59
59 -
 60
60 -
 61
61 -
 62
62 -
 63
63 -
 64
64 -
 65
65 -
 66
66 -
 67
67 -
 68
68 -
 69
69 -
 70
70 -
71
-
72
-
73
-
74
-
75
-
76
-
77
-
78
-
79
-
80
-
81
-
82
-
83
-
84
-
85
-
86
-
87
-
88
-
89
-
90
-
91
-
92
-
93
-
94
-
95
-
96
-
97
-
98
-
99
-
100
-
101
-
102
-
103
-
104
-
105
-
106
-
107
-
108
-
109
-
110
-
111
-
112
-
113
-
114
-
115
-
116
-
117
-
118
-
119
-
120
-
121
-
122
-
123
-
124
-
125
-
126
-
127
-
128
-
129
-
130
-
131
-
132
-
133
-
134
-
135
-
136
-
137
-
138
-
139
-
140
-
141
-
142
-
143
-
144
-
145
-
146
-
147
-
148
-
149
-
150
-
151
-
152
-
153
-
154
-
155
-
156
-
157
-
158
-
159
-
160
-
161
-
162
-
163
-
164
-
165
-
166
-
167
-
168
-
169
-
170
-
171
-
172
-
173
-
174
-
175
-
176
-
177
-
178
-
179
-
180
-
181
-
182
-
183
-
184
-
185
-
186
-
187
-
188
-
189
-
190
-
191
-
192
-
193
-
194
-
195
-
196
-
197
-
198
-
199
-
200
-
201
-
202
-
203
-
204
-
205
-
206
-
207
-
208
-
209
-
210
-
211
-
212
-
213
-
214
-
215
-
216
-
217
-
218
-
219
-
220
-
221
-
222
-
223
-
224
-
225
-
226
-
227
-
228
-
229
-
230
-
231
-
232
-
233
-
234
-
235
-
236
-
237
-
238
-
239
-
240
-
241
-
242
-
243
-
244
-
245
-
246
-
247
-
248
-
249
-
250
 |
 |

42
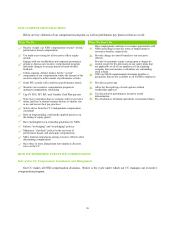
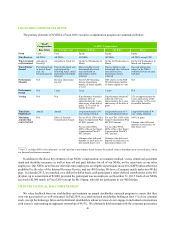
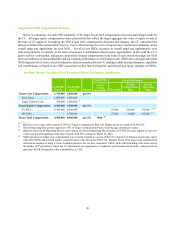
(4) Represents the aggregate fair value of the target amount of the equity awards the CC intended to deliver at the time the awards
were approved by the CC. Our CC considers RSUs to be inherently “at-risk” pay that is performance-based because their value
is dependent upon our stock price, which is a financial performance measure, over a 4-year vesting period.
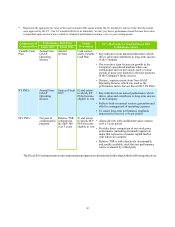
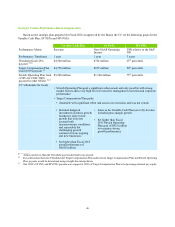
Component of
Compensation Performance Metric for Metric
Determines CC’s Rationale for Selected Fiscal 2016
Performance MetricFiscal 2015 Fiscal 2016
Variable Cash
Plan Annual Non-
GAAP
Operating
Income
Annual
revenue Cash earned
under Variable
Cash Plan • Key indicator of our annual performance which
drives value and contributes to long-term success
of the Company
• Our executive team focuses on growth in the
Company's specialized markets where our
technologies did not previously exist; revenue
growth in these new markets is the best predictor
of the Company's future success
• Distinct, separate metric from Non-GAAP
Operating Income, which was used as the
performance metric for our Fiscal 2015 SY PSUs
SY PSUs Annual Non-
GAAP
Operating
Income
Same as Fiscal
2015 If, and extent
to which, SY
PSUs become
eligible to vest
• Key indicator of our annual performance which
drives value and contributes to long-term success
of the Company
• Reflects both our annual revenue generation and
effective management of operating expenses
• To ensure long-term performance emphasis,
structured to vest over a 4-year period
MY PSUs Not part of
compensation
program
Relative TSR
compared to
the S&P 500
over 3 years
If, and extent
to which, MY
PSUs become
eligible to vest
• Aligns directly with stockholder value creation
over a 3-year period
• Provides direct comparison of our stock price
performance (including dividends) against an
index that represents a broader capital market
with which we compete
• Relative TSR is both objectively determinable
and readily available, such that our performance
can be evaluated by a third party
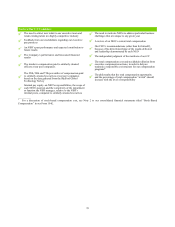
The Fiscal 2016 enhancements to our compensation program were intended to further align with the following objectives: