NVIDIA 2016 Annual Report Download - page 175
Download and view the complete annual report
Please find page 175 of the 2016 NVIDIA annual report below. You can navigate through the pages in the report by either clicking on the pages listed below, or by using the keyword search tool below to find specific information within the annual report.-
 1
1 -
2
-
3
-
4
-
5
-
6
-
7
-
8
-
9
-
10
-
11
-
12
-
13
-
14
-
15
-
16
-
17
-
18
-
19
-
20
-
21
-
22
-
23
-
24
-
25
-
26
-
27
-
28
-
29
-
30
-
31
-
32
-
33
-
34
-
35
-
36
-
37
-
38
-
39
-
40
-
41
-
42
-
43
-
44
-
45
-
46
-
47
-
48
-
49
-
50
-
51
-
52
-
53
-
54
-
55
-
56
-
57
-
58
-
59
-
60
-
61
-
62
-
63
-
64
-
65
-
66
-
67
-
68
-
69
-
70
-
71
-
72
-
73
-
74
-
75
-
76
-
77
-
78
-
79
-
80
-
81
-
82
-
83
-
84
-
85
-
86
-
87
-
88
-
89
-
90
-
91
-
92
-
93
-
94
-
95
-
96
-
97
-
98
-
99
-
100
-
101
-
102
-
103
-
104
-
105
-
106
-
107
-
108
-
109
-
110
-
111
-
112
-
113
-
114
-
115
-
116
-
117
-
118
-
119
-
120
-
121
-
122
-
123
-
124
-
125
-
126
-
127
-
128
-
129
-
130
-
131
-
132
-
133
-
134
-
135
-
136
-
137
-
138
-
139
-
140
-
141
-
142
-
143
-
144
-
145
-
146
-
147
-
148
-
149
-
150
-
151
-
152
-
153
-
154
-
155
-
156
-
157
-
158
-
159
-
160
-
161
-
162
-
163
-
164
-
 165
165 -
 166
166 -
 167
167 -
 168
168 -
 169
169 -
 170
170 -
 171
171 -
 172
172 -
 173
173 -
 174
174 -
 175
175 -
 176
176 -
 177
177 -
 178
178 -
 179
179 -
 180
180 -
 181
181 -
 182
182 -
 183
183 -
 184
184 -
 185
185 -
186
-
187
-
188
-
189
-
190
-
191
-
192
-
193
-
194
-
195
-
196
-
197
-
198
-
199
-
200
-
201
-
202
-
203
-
204
-
205
-
206
-
207
-
208
-
209
-
210
-
211
-
212
-
213
-
214
-
215
-
216
-
217
-
218
-
219
-
220
-
221
-
222
-
223
-
224
-
225
-
226
-
227
-
228
-
229
-
230
-
231
-
232
-
233
-
234
-
235
-
236
-
237
-
238
-
239
-
240
-
241
-
242
-
243
-
244
-
245
-
246
-
247
-
248
-
249
-
250
 |
 |

29
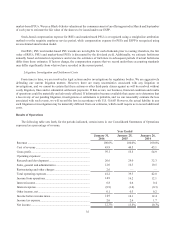
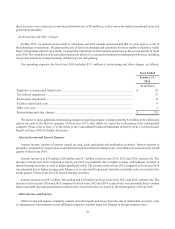
Recent Developments, Future Objectives and Challenges
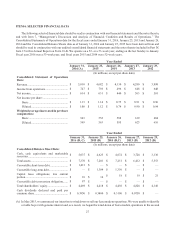
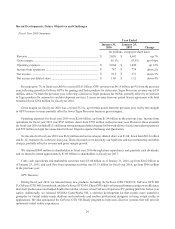
Fiscal Year 2016 Summary
Year Ended
January 31,
2016
January 25,
2015 Change
(In millions, except per share data)
Revenue ................................................................................................ $ 5,010 $ 4,682 up 7%
Gross margin......................................................................................... 56.1% 55.5% up 60 bps
Operating expenses............................................................................... $ 2,064 $ 1,840 up 12%
Income from operations........................................................................ $ 747 $ 759 down 2%
Net income............................................................................................ $ 614 $ 631 down 3%
Net income per diluted share ................................................................ $ 1.08 $ 1.12 down 4%
Revenue grew 7% in fiscal year 2016 to a record $5.01 billion. GPU revenue was $4.19 billion, up 9% from the previous
year, reflecting growth in GeForce GPUs for gaming and Tesla products for datacenter. Tegra Processor revenue was $559
million, down 3% from the previous year, reflecting a decline in Tegra products for OEMs, partially offset by an increase
in Tegra products for automotive and development services. License revenue from our patent license agreement with Intel
remained flat at $264 million for fiscal year 2016.
Gross margin for fiscal year 2016 was a record 56.1%, up 60 basis points from the previous year, led by the strength
in GPU business revenue partially offset by lower Tegra Processor business gross margins.
Operating expenses for fiscal year 2016 were $2.06 billion, up from $1.84 billion in the previous year. Income from
operations for fiscal year 2016 was $747 million, down from $759 million in the previous year. However, these amounts
for fiscal year 2016 included $131 million in restructuring and other charges for the wind-down of our Icera modem operations
and $70 million in legal fees associated with our litigation against Samsung and Qualcomm.
Net income for fiscal year 2016 was $614 million and net income per diluted share was $1.08, down from $631 million
and $1.12, respectively, in the previous year. These decreases were driven by our legal fees and our restructuring and other
charges, partially offset by revenue and gross margin growth.
We returned $800 million to shareholders in fiscal year 2016 through share repurchases and quarterly cash dividends,
and we intend to return approximately $1.00 billion to shareholders in fiscal year 2017.
Cash, cash equivalents and marketable securities were $5.04 billion as of January 31, 2016, up from $4.62 billion as
of January 25, 2015, and cash flow from operating activities was $1.18 billion for fiscal year 2016, up from $906 million
in the previous year.
GPU Business
During fiscal year 2016, we released many new products, including the GeForce GTX TITAN X, GeForce GTX 980
Ti, GeForce GTX 980 for notebook, and the GeForce GTX 950. These GPUs deliver better performance and power efficiency
than their predecessors and helped double the number of users of our GeForce Experience PC gaming platform from a year
earlier. Additionally, we released NVIDIA GameWorks VR, a software development kit that creates more immersive
gameplay on virtual reality-ready desktops and notebooks and enables professional designers to bring virtual reality to
applications. We also announced the GeForce GTX VR Ready program to help users discover systems that will provide
optimized virtual reality experiences.