NVIDIA 2016 Annual Report Download - page 218
Download and view the complete annual report
Please find page 218 of the 2016 NVIDIA annual report below. You can navigate through the pages in the report by either clicking on the pages listed below, or by using the keyword search tool below to find specific information within the annual report.-
 1
1 -
2
-
3
-
4
-
5
-
6
-
7
-
8
-
9
-
10
-
11
-
12
-
13
-
14
-
15
-
16
-
17
-
18
-
19
-
20
-
21
-
22
-
23
-
24
-
25
-
26
-
27
-
28
-
29
-
30
-
31
-
32
-
33
-
34
-
35
-
36
-
37
-
38
-
39
-
40
-
41
-
42
-
43
-
44
-
45
-
46
-
47
-
48
-
49
-
50
-
51
-
52
-
53
-
54
-
55
-
56
-
57
-
58
-
59
-
60
-
61
-
62
-
63
-
64
-
65
-
66
-
67
-
68
-
69
-
70
-
71
-
72
-
73
-
74
-
75
-
76
-
77
-
78
-
79
-
80
-
81
-
82
-
83
-
84
-
85
-
86
-
87
-
88
-
89
-
90
-
91
-
92
-
93
-
94
-
95
-
96
-
97
-
98
-
99
-
100
-
101
-
102
-
103
-
104
-
105
-
106
-
107
-
108
-
109
-
110
-
111
-
112
-
113
-
114
-
115
-
116
-
117
-
118
-
119
-
120
-
121
-
122
-
123
-
124
-
125
-
126
-
127
-
128
-
129
-
130
-
131
-
132
-
133
-
134
-
135
-
136
-
137
-
138
-
139
-
140
-
141
-
142
-
143
-
144
-
145
-
146
-
147
-
148
-
149
-
150
-
151
-
152
-
153
-
154
-
155
-
156
-
157
-
158
-
159
-
160
-
161
-
162
-
163
-
164
-
165
-
166
-
167
-
168
-
169
-
170
-
171
-
172
-
173
-
174
-
175
-
176
-
177
-
178
-
179
-
180
-
181
-
182
-
183
-
184
-
185
-
186
-
187
-
188
-
189
-
190
-
191
-
192
-
193
-
194
-
195
-
196
-
197
-
198
-
199
-
200
-
201
-
202
-
203
-
204
-
205
-
206
-
207
-
 208
208 -
 209
209 -
 210
210 -
 211
211 -
 212
212 -
 213
213 -
 214
214 -
 215
215 -
 216
216 -
 217
217 -
 218
218 -
 219
219 -
 220
220 -
 221
221 -
 222
222 -
 223
223 -
 224
224 -
 225
225 -
 226
226 -
 227
227 -
 228
228 -
229
-
230
-
231
-
232
-
233
-
234
-
235
-
236
-
237
-
238
-
239
-
240
-
241
-
242
-
243
-
244
-
245
-
246
-
247
-
248
-
249
-
250
 |
 |

NVIDIA CORPORATION AND SUBSIDIARIES
NOTES TO THE CONSOLIDATED FINANCIAL STATEMENTS
(Continued)
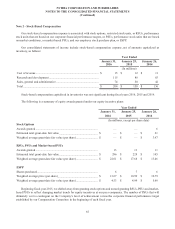
72
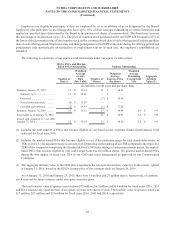
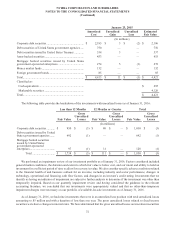
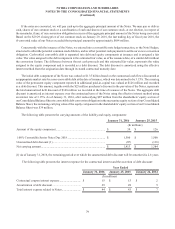
January 25, 2015
Amortized
Cost
Unrealized
Gain
Unrealized
Loss
Estimated
Fair Value
(In millions)
Corporate debt securities................................................... $ 2,185 $ 3 $ (2) $ 2,186
Debt securities of United States government agencies ..... 750 — — 750
Debt securities issued by United States Treasury ............. 534 3 — 537
Asset-backed securities ..................................................... 453 — — 453
Mortgage backed securities issued by United States
government-sponsored enterprises.................................... 274 5 (1) 278
Money market funds ......................................................... 132 — — 132
Foreign government bonds................................................ 85——85
Total................................................................................... $ 4,413 $ 11 $ (3) $ 4,421
Classified as:
Cash equivalents ............................................................. $295
Marketable securities ...................................................... 4,126
Total................................................................................... $ 4,421
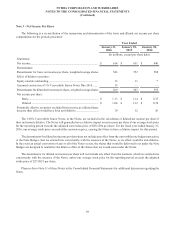
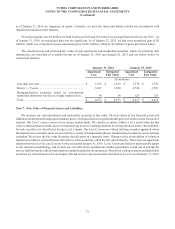
The following table provides the breakdown of the investments with unrealized losses as of January 31, 2016:
Less than 12 Months 12 Months or Greater Total
Fair Value
Gross
Unrealized
Losses Fair Value
Gross
Unrealized
Losses Fair Value
Gross
Unrealized
Losses
(In millions)
Corporate debt securities............ $ 950 $ (3) $ 80 $ — $ 1,030 $ (3)
Debt securities issued by United
States government agencies ....... 692 (1) — — 692 (1)
Mortgage backed securities
issued by United States
government-sponsored
enterprises .................................. 97 (1) 31 — 128 (1)
Total ............................... $ 1,739 $ (5) $ 111 $ — $ 1,850 $ (5)
We performed an impairment review of our investment portfolio as of January 31, 2016. Factors considered included
general market conditions, the duration and extent to which fair value is below cost, and our intent and ability to hold an
investment for a sufficient period of time to allow for recovery in value. We also consider specific adverse conditions related
to the financial health of and business outlook for an investee, including industry and sector performance, changes in
technology, operational and financing cash flow factors, and changes in an investee’s credit rating. Investments that we
identify as having an indicator of impairment are subject to further analysis to determine if the investment was other than
temporarily impaired. Based on our quarterly impairment review and having considered the guidance in the relevant
accounting literature, we concluded that our investments were appropriately valued and that no other-than-temporary
impairment charges were necessary on our portfolio of available-for-sale investments as of January 31, 2016.
As of January 31, 2016, we had nine investments that were in an unrealized loss position with total unrealized losses
amounting to $5 million and with a duration of less than one year. The gross unrealized losses related to fixed income
securities were due to changes in interest rates. We have determined that the gross unrealized losses on investment securities