NVIDIA 2016 Annual Report Download - page 201
Download and view the complete annual report
Please find page 201 of the 2016 NVIDIA annual report below. You can navigate through the pages in the report by either clicking on the pages listed below, or by using the keyword search tool below to find specific information within the annual report.-
 1
1 -
2
-
3
-
4
-
5
-
6
-
7
-
8
-
9
-
10
-
11
-
12
-
13
-
14
-
15
-
16
-
17
-
18
-
19
-
20
-
21
-
22
-
23
-
24
-
25
-
26
-
27
-
28
-
29
-
30
-
31
-
32
-
33
-
34
-
35
-
36
-
37
-
38
-
39
-
40
-
41
-
42
-
43
-
44
-
45
-
46
-
47
-
48
-
49
-
50
-
51
-
52
-
53
-
54
-
55
-
56
-
57
-
58
-
59
-
60
-
61
-
62
-
63
-
64
-
65
-
66
-
67
-
68
-
69
-
70
-
71
-
72
-
73
-
74
-
75
-
76
-
77
-
78
-
79
-
80
-
81
-
82
-
83
-
84
-
85
-
86
-
87
-
88
-
89
-
90
-
91
-
92
-
93
-
94
-
95
-
96
-
97
-
98
-
99
-
100
-
101
-
102
-
103
-
104
-
105
-
106
-
107
-
108
-
109
-
110
-
111
-
112
-
113
-
114
-
115
-
116
-
117
-
118
-
119
-
120
-
121
-
122
-
123
-
124
-
125
-
126
-
127
-
128
-
129
-
130
-
131
-
132
-
133
-
134
-
135
-
136
-
137
-
138
-
139
-
140
-
141
-
142
-
143
-
144
-
145
-
146
-
147
-
148
-
149
-
150
-
151
-
152
-
153
-
154
-
155
-
156
-
157
-
158
-
159
-
160
-
161
-
162
-
163
-
164
-
165
-
166
-
167
-
168
-
169
-
170
-
171
-
172
-
173
-
174
-
175
-
176
-
177
-
178
-
179
-
180
-
181
-
182
-
183
-
184
-
185
-
186
-
187
-
188
-
189
-
190
-
 191
191 -
 192
192 -
 193
193 -
 194
194 -
 195
195 -
 196
196 -
 197
197 -
 198
198 -
 199
199 -
 200
200 -
 201
201 -
 202
202 -
 203
203 -
 204
204 -
 205
205 -
 206
206 -
 207
207 -
 208
208 -
 209
209 -
 210
210 -
 211
211 -
212
-
213
-
214
-
215
-
216
-
217
-
218
-
219
-
220
-
221
-
222
-
223
-
224
-
225
-
226
-
227
-
228
-
229
-
230
-
231
-
232
-
233
-
234
-
235
-
236
-
237
-
238
-
239
-
240
-
241
-
242
-
243
-
244
-
245
-
246
-
247
-
248
-
249
-
250
 |
 |

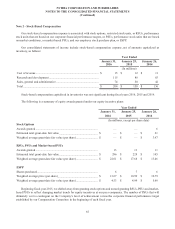
55
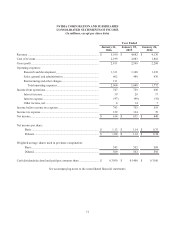
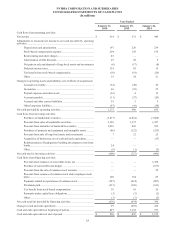
NVIDIA CORPORATION AND SUBSIDIARIES
CONSOLIDATED STATEMENTS OF CASH FLOWS
(In millions)
Year Ended
January 31,
2016
January 25,
2015
January 26,
2014
Cash flows from operating activities:
Net income................................................................................................. $ 614 $ 631 $ 440
Adjustments to reconcile net income to net cash provided by operating
activities:....................................................................................................
Depreciation and amortization ........................................................ 197 220 239
Stock-based compensation expense ................................................ 204 158 136
Restructuring and other charges...................................................... 45 — —
Amortization of debt discount......................................................... 29 28 5
Net gain on sale and disposal of long-lived assets and investments (6) (17) (8)
Deferred income taxes..................................................................... 134 83 15
Tax benefit from stock-based compensation................................... (10) (18) (26)
Other................................................................................................ 19 24 21
Changes in operating assets and liabilities, net of effects of acquisitions:
Accounts receivable ........................................................................ (32) (49) 29
Inventories....................................................................................... 66 (95) 25
Prepaid expenses and other assets................................................... (16) 4 12
Accounts payable ............................................................................ (11) (27) (20)
Accrued and other current liabilities ............................................... 39 5 5
Other long-term liabilities ............................................................... (97) (41) (38)
Net cash provided by operating activities.................................................. 1,175 906 835
Cash flows from investing activities:
Purchases of marketable securities.................................................. (3,477) (2,862) (3,066)
Proceeds from sales of marketable securities.................................. 2,102 1,372 1,927
Proceeds from maturities of marketable securities ......................... 1,036 865 585
Purchases of property and equipment and intangible assets ........... (86) (122) (255)
Proceeds from sale of long-lived assets and investments ............... 72125
Acquisition of businesses, net of cash and cash equivalents........... — — (17)
Reimbursement of headquarters building development costs from
banks................................................................................................ 24 — —
Other................................................................................................ (6) (1) (5)
Net cash used in investing activities .......................................................... (400) (727) (806)
Cash flows from financing activities:
Proceeds from issuance of convertible notes, net ........................... — — 1,478
Purchase of convertible note hedges ............................................... — — (167)
Proceeds from the sale of common stock warrants......................... —— 59
Proceeds from issuance of common stock under employee stock
plans ................................................................................................ 120 154 69
Payments related to repurchases of common stock......................... (587) (814) (887)
Dividends paid................................................................................. (213) (186) (181)
Tax benefit from stock-based compensation................................... 10 18 26
Payments under capital lease obligations........................................ (3) (3) (2)
Other................................................................................................ (3) (3) (5)
Net cash (used in) provided by financing activities................................... (676) (834) 390
Change in cash and cash equivalents......................................................... 99 (655) 419
Cash and cash equivalents at beginning of period..................................... 497 1,152 733
Cash and cash equivalents at end of period ............................................... $ 596 $ 497 $ 1,152