ICICI Bank 2007 Annual Report Download - page 89
Download and view the complete annual report
Please find page 89 of the 2007 ICICI Bank annual report below. You can navigate through the pages in the report by either clicking on the pages listed below, or by using the keyword search tool below to find specific information within the annual report.-
 1
1 -
2
-
3
-
4
-
5
-
6
-
7
-
8
-
9
-
10
-
11
-
12
-
13
-
14
-
15
-
16
-
17
-
18
-
19
-
20
-
21
-
22
-
23
-
24
-
25
-
26
-
27
-
28
-
29
-
30
-
31
-
32
-
33
-
34
-
35
-
36
-
37
-
38
-
39
-
40
-
41
-
42
-
43
-
44
-
45
-
46
-
47
-
48
-
49
-
50
-
51
-
52
-
53
-
54
-
55
-
56
-
57
-
58
-
59
-
60
-
61
-
62
-
63
-
64
-
65
-
66
-
67
-
68
-
69
-
70
-
71
-
72
-
73
-
74
-
75
-
76
-
77
-
78
-
 79
79 -
 80
80 -
 81
81 -
 82
82 -
 83
83 -
 84
84 -
 85
85 -
 86
86 -
 87
87 -
 88
88 -
 89
89 -
 90
90 -
 91
91 -
 92
92 -
 93
93 -
 94
94 -
 95
95 -
 96
96 -
 97
97 -
 98
98 -
 99
99 -
100
-
101
-
102
-
103
-
104
-
105
-
106
-
107
-
108
-
109
-
110
-
111
-
112
-
113
-
114
-
115
-
116
-
117
-
118
-
119
-
120
-
121
-
122
-
123
-
124
-
125
-
126
-
127
-
128
-
129
-
130
-
131
-
132
-
133
-
134
-
135
-
136
-
137
-
138
-
139
-
140
-
141
-
142
-
143
-
144
-
145
-
146
-
147
-
148
-
149
-
150
-
151
-
152
-
153
-
154
-
155
-
156
-
157
-
158
-
159
-
160
-
161
-
162
-
163
-
164
-
165
-
166
-
167
-
168
-
169
-
170
-
171
-
172
-
173
-
174
-
175
-
176
-
177
-
178
 |
 |

F19
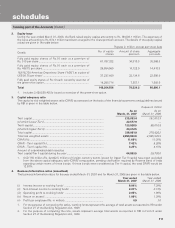
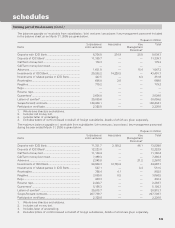
Geographical segmental results are given below.
Rupees in million
Domestic operations Foreign operations Total
Particulars For the For the For the For the For the For the
year ended year ended year ended year ended year ended year ended
31.03.07 31.03.06 31.03.07 31.03.06 31.03.07 31.03.06
1. Revenue 268,961.9 183,348.0 20,272.7 9,544.7 289,234.6 192,892.7
2. Assets 3,039,670.0 2,295,744.9 406,911.1 218,144.6 3,446,581.1 2,513,889.5
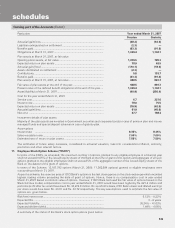
6. Earnings Per Share
Basic and diluted earnings per equity share are computed in accordance with Accounting Standard 20, “Earnings per Share”.
Basic earnings per share is computed by dividing net profit after tax by the weighted average number of equity shares
outstanding during the year. Diluted earnings per share is computed using the weighted average number of equity shares
and dilutive potential equity shares outstanding during the year.
The computation of earnings per share is given below.
Rupees in million, except per share data
Year ended Year ended
March 31, 2007 March 31, 2006
Basic
Weighted average no. of equity shares outstanding ................................. 892,820,768 781,693,773
Net profit ..................................................................................................... 31,102.2 25,400.7
Basic earnings per share (Rs.) .................................................................... 34.84 32.49
Diluted
Weighted average no. of equity shares outstanding ................................. 897,743,476 789,963,635
Net profit ..................................................................................................... 31,102.2 25,400.7
Diluted earnings per share (Rs.) ................................................................. 34.64 32.15
Nominal value per share (Rs.) ..................................................................... 10.00 10.00
The dilutive impact is due to options granted to employees by the Bank.
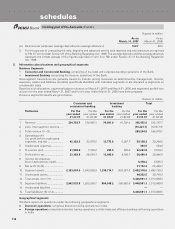
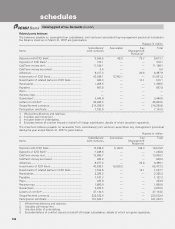
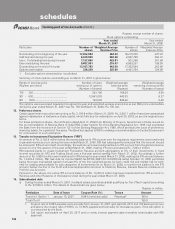
7. Maturity pattern
• In compiling the information of maturity pattern (refer 7. (a) and (b) below), certain estimates and assumptions have
been made by the management.
• Assets and liabilities in foreign currency exclude off-balance sheet assets and liabilities.
a) The maturity pattern of assets and liabilities of the Bank as on March 31, 2007 is given below.
Rupees in million
Total foreign Total foreign
Maturity Loans & Investment currency currency
buckets advances1 securities1 Deposits1 Borrowings1 assets liabilities
1 to 14 days ....................... 92,885.1 45,292.9 223,743.2 9,453.3 94,285.0 47,662.5
15 to 28 days ..................... 24,562.0 97,922.7 104,126.2 5,694.1 12,626.0 10,878.7
29 days to 3 months ......... 96,063.1 97,022.5 341,989.9 44,171.4 34,763.7 54,592.9
3 to 6 months .................... 128,770.4 85,208.4 322,724.8 70,423.4 28,473.7 56,766.2
6 months to 1 year ............ 208,006.2 173,803.9 594,972.4 82,016.6 92,005.7 83,910.9
1 to 3 years ........................ 763,016.1 156,450.4 674,036.1 158,216.9 56,812.0 137,945.8
3 to 5 years ........................ 251,094.3 68,280.5 31,354.7 122,375.6 68,987.5 103,222.6
Above 5 years .................... 394,258.8 188,597.1 12,154.6 20,209.0 105,876.0 71,292.1
Total .................................. 1,958,656.0 912,578.4 2,305,101.9 512,560.3 493,829.6 566,271.7
1. Includes foreign currency balances.
forming part of the Accounts (Contd.)
schedules