ICICI Bank 2007 Annual Report Download - page 79
Download and view the complete annual report
Please find page 79 of the 2007 ICICI Bank annual report below. You can navigate through the pages in the report by either clicking on the pages listed below, or by using the keyword search tool below to find specific information within the annual report.-
 1
1 -
2
-
3
-
4
-
5
-
6
-
7
-
8
-
9
-
10
-
11
-
12
-
13
-
14
-
15
-
16
-
17
-
18
-
19
-
20
-
21
-
22
-
23
-
24
-
25
-
26
-
27
-
28
-
29
-
30
-
31
-
32
-
33
-
34
-
35
-
36
-
37
-
38
-
39
-
40
-
41
-
42
-
43
-
44
-
45
-
46
-
47
-
48
-
49
-
50
-
51
-
52
-
53
-
54
-
55
-
56
-
57
-
58
-
59
-
60
-
61
-
62
-
63
-
64
-
65
-
66
-
67
-
68
-
 69
69 -
 70
70 -
 71
71 -
 72
72 -
 73
73 -
 74
74 -
 75
75 -
 76
76 -
 77
77 -
 78
78 -
 79
79 -
 80
80 -
 81
81 -
 82
82 -
 83
83 -
 84
84 -
 85
85 -
 86
86 -
 87
87 -
 88
88 -
 89
89 -
90
-
91
-
92
-
93
-
94
-
95
-
96
-
97
-
98
-
99
-
100
-
101
-
102
-
103
-
104
-
105
-
106
-
107
-
108
-
109
-
110
-
111
-
112
-
113
-
114
-
115
-
116
-
117
-
118
-
119
-
120
-
121
-
122
-
123
-
124
-
125
-
126
-
127
-
128
-
129
-
130
-
131
-
132
-
133
-
134
-
135
-
136
-
137
-
138
-
139
-
140
-
141
-
142
-
143
-
144
-
145
-
146
-
147
-
148
-
149
-
150
-
151
-
152
-
153
-
154
-
155
-
156
-
157
-
158
-
159
-
160
-
161
-
162
-
163
-
164
-
165
-
166
-
167
-
168
-
169
-
170
-
171
-
172
-
173
-
174
-
175
-
176
-
177
-
178
 |
 |

F9
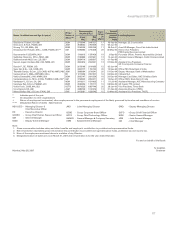
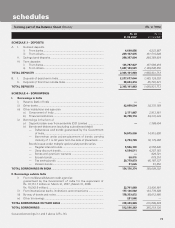
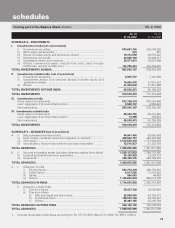
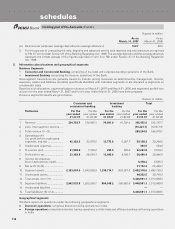
SCHEDULE 8 – INVESTMENTS
I. Investments in India [net of provisions]
i) Government securities ........................................................................ 673,681,742 510,744,392
ii) Other approved securities................................................................... 601 601
iii) Shares (includes equity and preference shares) ................................ 19,372,558 20,578,522
iv) Debentures and bonds ...................................................................... 24,628,194 18,040,317
v) Subsidiaries and/or joint ventures ....................................................... 26,071,831 16,691,698
vi) Others (commercial paper, mutual fund units, pass through
certificates, security receipts etc.) ..................................................... 123,785,241 104,308,855
TOTAL INVESTMENTS IN INDIA ...................................................................... 867,540,167 670,364,385
II. Investments outside India [net of provisions]
i) Government securities ........................................................................ 2,965,737 1,342,384
ii) Subsidiaries and/or joint ventures abroad (includes equity and
preference shares) ............................................................................ 14,650,476 11,915,291
iii) Others ............................................................................................. 27,422,038 31,851,884
TOTAL INVESTMENTS OUTSIDE INDIA .......................................................... 45,038,251 45,109,559
TOTAL INVESTMENTS ...................................................................................... 912,578,418 715,473,944
III. Investments in India
Gross value of investments ........................................................................ 873,108,274 675,324,809
Less: Aggregate of provision/depreciation ................................................ 5,568,107 4,960,424
Net investments .......................................................................................... 867,540,167 670,364,385
IV. Investments outside India
Gross value of investments ........................................................................ 45,052,750 45,215,492
Less: Aggregate of provision/depreciation ................................................ 14,499 105,933
Net investments .......................................................................................... 45,038,251 45,109,559
TOTAL INVESTMENTS ...................................................................................... 912,578,418 715,473,944
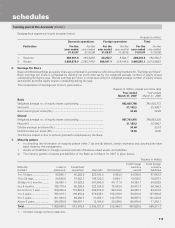
SCHEDULE 9 – ADVANCES [net of provisions]
A. i) Bills purchased and discounted .......................................................... 44,947,460 63,065,998
ii) Cash credits, overdrafts and loans repayable on demand ................. 328,642,181 249,328,298
iii) Term loans........................................................................................... 1,512,550,418 1,117,904,639
iv) Securitisation, finance lease and hire purchase receivables1 ............ 72,515,937 31,332,154
TOTAL ADVANCES ............................................................................................ 1,958,655,996 1,461,631,089
B. i) Secured by tangible assets [includes advances against book debts] 1,528,133,832 1,199,732,405
ii) Covered by Bank/Government guarantees ......................................... 34,195,829 13,508,731
iii) Unsecured ........................................................................................... 396,326,335 248,389,953
TOTAL ADVANCES ............................................................................................ 1,958,655,996 1,461,631,089
C. I. Advances in India
i) Priority Sector .............................................................................. 552,772,378 426,756,181
ii) Public Sector ............................................................................... 4,017,005 11,572,043
iii) Banks ........................................................................................... 906,063 48,863
iv) Others .......................................................................................... 1,156,860,404 898,014,748
TOTAL ADVANCES IN INDIA ............................................................................ 1,714,555,850 1,336,391,835
II. Advances outside India
i) Due from banks ........................................................................... 30,027,302 18,559,863
ii) Due from others
a) Bills purchased and discounted .......................................... 22,000,550 43,769,271
b) Syndicated loans ................................................................. 146,579,129 29,704,361
c) Others .................................................................................. 45,493,165 33,205,759
TOTAL ADVANCES OUTSIDE INDIA ................................................................ 244,100,146 125,239,254
TOTAL ADVANCES ............................................................................................ 1,958,655,996 1,461,631,089
1. Includes receivables under lease amounting to Rs. 577.9 million (March 31, 2006: Rs. 695.1 million).
(Rs. in ‘000s)
forming part of the Balance Sheet (Contd.)
As on As on
31.03.2007 31.03.2006
schedules