ICICI Bank 2007 Annual Report Download - page 142
Download and view the complete annual report
Please find page 142 of the 2007 ICICI Bank annual report below. You can navigate through the pages in the report by either clicking on the pages listed below, or by using the keyword search tool below to find specific information within the annual report.-
 1
1 -
2
-
3
-
4
-
5
-
6
-
7
-
8
-
9
-
10
-
11
-
12
-
13
-
14
-
15
-
16
-
17
-
18
-
19
-
20
-
21
-
22
-
23
-
24
-
25
-
26
-
27
-
28
-
29
-
30
-
31
-
32
-
33
-
34
-
35
-
36
-
37
-
38
-
39
-
40
-
41
-
42
-
43
-
44
-
45
-
46
-
47
-
48
-
49
-
50
-
51
-
52
-
53
-
54
-
55
-
56
-
57
-
58
-
59
-
60
-
61
-
62
-
63
-
64
-
65
-
66
-
67
-
68
-
69
-
70
-
71
-
72
-
73
-
74
-
75
-
76
-
77
-
78
-
79
-
80
-
81
-
82
-
83
-
84
-
85
-
86
-
87
-
88
-
89
-
90
-
91
-
92
-
93
-
94
-
95
-
96
-
97
-
98
-
99
-
100
-
101
-
102
-
103
-
104
-
105
-
106
-
107
-
108
-
109
-
110
-
111
-
112
-
113
-
114
-
115
-
116
-
117
-
118
-
119
-
120
-
121
-
122
-
123
-
124
-
125
-
126
-
127
-
128
-
129
-
130
-
131
-
 132
132 -
 133
133 -
 134
134 -
 135
135 -
 136
136 -
 137
137 -
 138
138 -
 139
139 -
 140
140 -
 141
141 -
 142
142 -
 143
143 -
 144
144 -
 145
145 -
 146
146 -
 147
147 -
 148
148 -
 149
149 -
 150
150 -
 151
151 -
 152
152 -
153
-
154
-
155
-
156
-
157
-
158
-
159
-
160
-
161
-
162
-
163
-
164
-
165
-
166
-
167
-
168
-
169
-
170
-
171
-
172
-
173
-
174
-
175
-
176
-
177
-
178
 |
 |

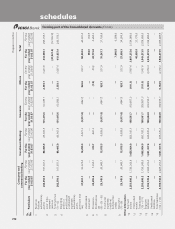
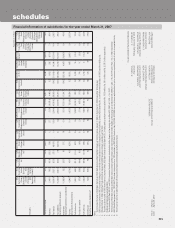
F72
Rupees in million
Consumer and
commercial banking Investment Banking Insurance Others Total
Sr.
No Particulars For the
year ended
31.03.07
For the
year ended
31.03.06
For the
year ended
31.03.07
For the
year ended
31.03.06
For the
year ended
31.03.07
For the
year ended
31.03.06
For the
year ended
31.03.07
For the
year ended
31.03.06
For the
year ended
31.03.07
For the
year ended
31.03.06
1Revenue
(before
extraordinary
profit) 242,354.5 157,541.3 88,495.9 46,383.9 101,415.6 53,386.1 2,393.1 1,427.8 434,659.1 258,739.1
2Less: Inter-
segment
revenue — — — — — — — — (21,021.2) (12,584.0)
3Total revenue
(1) – (2) 242,354.5 157,541.3 88,495.9 46,383.9 101,415.6 53,386.1 2,393.1 1,427.8 413,637.9 246,155.1
4Operating
profit (i.e.
profit before
unallocated
expenses
extraordinary
profit,
provision and
tax) 47,501.1 33,572.8 14,295.0 6,621.4 (3,917.8) (494.7) 526.6 337.7 58,404.9 40,037.2
5Unallocated
expenses — — — — — — — — 384.0 384.0
6 Provisions 22,355.6 7,532.1 419.7 922.4 — — (1.5) (0.2) 22,773.8 8,454.3
7Profit before
tax
(4) – (5) – (6) 25,145.5 26,040.7 13,875.3 5,699.0 (3,917.8) (494.7) 528.1 337.9 35,247.1 31,198.9
8Income tax
expenses
(net)/(net
deferred tax
credit) — — — — — — — — 7,640.8 6,998.0
9Net profit
(7) – (8) 25,145.5 26,040.7 13,875.3 5,699.0 (3,917.8) (494.7) 528.1 337.9 27,606.3 24,200.9
Other Information
10 Segment
assets 2,253,098.2 1,735,245.8 1,455,864.0 892,103.3 188,501.7 109,667.3 (191.3) 1,067.6 3,897,272.6 2,738,084.0
11 Unallocated
assets — — — — — — — — 46,000.9 31,776.0
12 Total assets
(10) + (11) 2,253,098.2 1,735,245.8 1,455,864.0 892,103.3 188,501.7 109,667.3 (191.3) 1,067.6 3,943,273.5 2,769,860.0
13 Segment
liabilities 2,705,738.6 2,020,233.8 1,051,307.6 645,245.2 180,044.8 100,010.7 6,182.5 4,370.3 3,943,273.5 2,769,860.0
14 Unallocated
liabilities — — — — — — — — — —
15 Total liabilities
(13) + (14) 2,705,738.6 2,020,233.8 1,051,307.6 645,245.2 180,044.8 100,010.7 6,182.5 4,370.3 3,943,273.5 2,769,860.0
schedules
forming part of the Consolidated Accounts (Contd.)