ICICI Bank 2007 Annual Report Download - page 87
Download and view the complete annual report
Please find page 87 of the 2007 ICICI Bank annual report below. You can navigate through the pages in the report by either clicking on the pages listed below, or by using the keyword search tool below to find specific information within the annual report.-
 1
1 -
2
-
3
-
4
-
5
-
6
-
7
-
8
-
9
-
10
-
11
-
12
-
13
-
14
-
15
-
16
-
17
-
18
-
19
-
20
-
21
-
22
-
23
-
24
-
25
-
26
-
27
-
28
-
29
-
30
-
31
-
32
-
33
-
34
-
35
-
36
-
37
-
38
-
39
-
40
-
41
-
42
-
43
-
44
-
45
-
46
-
47
-
48
-
49
-
50
-
51
-
52
-
53
-
54
-
55
-
56
-
57
-
58
-
59
-
60
-
61
-
62
-
63
-
64
-
65
-
66
-
67
-
68
-
69
-
70
-
71
-
72
-
73
-
74
-
75
-
76
-
 77
77 -
 78
78 -
 79
79 -
 80
80 -
 81
81 -
 82
82 -
 83
83 -
 84
84 -
 85
85 -
 86
86 -
 87
87 -
 88
88 -
 89
89 -
 90
90 -
 91
91 -
 92
92 -
 93
93 -
 94
94 -
 95
95 -
 96
96 -
 97
97 -
98
-
99
-
100
-
101
-
102
-
103
-
104
-
105
-
106
-
107
-
108
-
109
-
110
-
111
-
112
-
113
-
114
-
115
-
116
-
117
-
118
-
119
-
120
-
121
-
122
-
123
-
124
-
125
-
126
-
127
-
128
-
129
-
130
-
131
-
132
-
133
-
134
-
135
-
136
-
137
-
138
-
139
-
140
-
141
-
142
-
143
-
144
-
145
-
146
-
147
-
148
-
149
-
150
-
151
-
152
-
153
-
154
-
155
-
156
-
157
-
158
-
159
-
160
-
161
-
162
-
163
-
164
-
165
-
166
-
167
-
168
-
169
-
170
-
171
-
172
-
173
-
174
-
175
-
176
-
177
-
178
 |
 |

F17
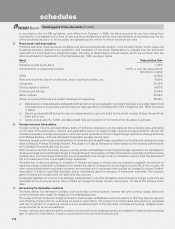
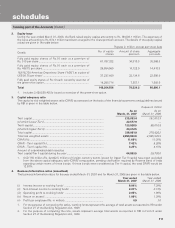
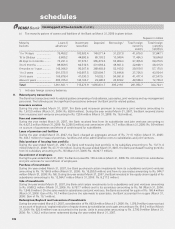
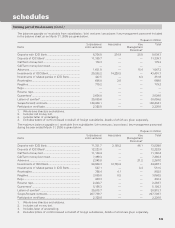
2. Equity issue
During the year ended March 31, 2006, the Bank raised equity capital amounting to Rs. 80,006.1 million. The expenses of
the issue amounting to Rs. 874.1 million have been charged to the share premium account. The details of the equity capital
raised are given in the table below.
Rupees in million, except per share data
Details No. of equity
shares Amount of share
premium Aggregate
proceeds
Fully paid equity shares of Rs.10 each at a premium of
Rs. 515 per share .................................................................... 67,787,322 34,910.5 35,588.3
Fully paid equity shares of Rs.10 each at a premium of
Rs. 488.75 per share ............................................................... 28,894,060 14,122.0 14,410.9
18,618,730 American Depository Share (“ADS”) at a price of
US$ 26.75 per share1 .............................................................. 37,237,460 22,134.6 22,506.9
Fully paid equity shares of Rs.10 each issued by exercise of
the green-shoe option ............................................................. 14,285,714 7,357.1 7,500.0
Total 148,204,556 78,524.2 80,006.1
1. Includes 2,428,530 ADSs issued on exercise of the green-shoe option.
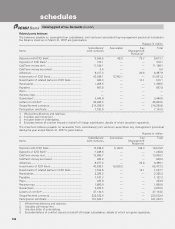
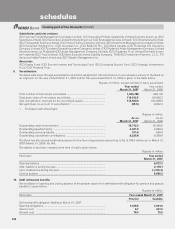
3. Capital adequacy ratio
The capital to risk weighted assets ratio (CRAR) as assessed on the basis of the financial statements and guidelines issued
by RBI is given in the table below.
Rupees in million
As on As on
March, 31, 2007 March 31, 2006
Tier I capital ................................................................................................. 215,033.4 191,815.3
(of which Lower Tier I) ................................................................................. 22,577.9 —
Tier II capital ................................................................................................ 123,928.5 86,610.9
(of which Upper Tier II) ................................................................................ 20,012.5 —
Total capital ................................................................................................. 338,961.9 278,426.2
Total risk weighted assets ......................................................................... 2,899,930.6 2,085,935.9
CRAR (%)..................................................................................................... 11.69% 13.35%
CRAR – Tier I capital (%) ............................................................................. 7.42% 9.20%
CRAR – Tier II capital (%) ............................................................................ 4.27% 4.15%
Amount of subordinated debt raised as
Tier I capital/Tier II capital during the year .................................................. 64,903.5 39,730.0
1. USD 750 million (Rs. 32,602.5 million) of foreign currency bonds issued for Upper Tier II capital have been excluded
from the above capital adequacy ratio (CRAR) computation, pending clarification required by Reserve Bank of India
regarding certain terms of these bonds. If these bonds were considered as Tier II capital, the total CRAR would be
12.81%.
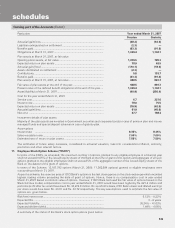
4. Business/information ratios (annualised)
The business/information ratios for the year ended March 31, 2007 and for March 31, 2006 are given in the table below.
Year ended Year ended
March 31, 2007 March 31, 2006
(i) Interest income to working funds1 ..................................................... 8.04% 7.30%
(ii) Non-interest income to working funds1 ............................................. 2.07% 2.13%
(iii) Operating profit to working funds1 .................................................... 2.05% 1.98%
(iv) Return on assets2 ................................................................................ 1.09% 1.30%
(v) Profit per employee (Rs. in million) ..................................................... 0.9 1.0
1. For the purpose of computing the ratios, working funds represent the average of total assets as reported to RBI under
Section 27 of the Banking Regulation Act, 1949.
2. For the purpose of computing the ratio, assets represent average total assets as reported to RBI in Form X under
Section 27 of the Banking Regulation Act, 1949.
forming part of the Accounts (Contd.)
schedules