ICICI Bank 2007 Annual Report Download - page 101
Download and view the complete annual report
Please find page 101 of the 2007 ICICI Bank annual report below. You can navigate through the pages in the report by either clicking on the pages listed below, or by using the keyword search tool below to find specific information within the annual report.-
 1
1 -
2
-
3
-
4
-
5
-
6
-
7
-
8
-
9
-
10
-
11
-
12
-
13
-
14
-
15
-
16
-
17
-
18
-
19
-
20
-
21
-
22
-
23
-
24
-
25
-
26
-
27
-
28
-
29
-
30
-
31
-
32
-
33
-
34
-
35
-
36
-
37
-
38
-
39
-
40
-
41
-
42
-
43
-
44
-
45
-
46
-
47
-
48
-
49
-
50
-
51
-
52
-
53
-
54
-
55
-
56
-
57
-
58
-
59
-
60
-
61
-
62
-
63
-
64
-
65
-
66
-
67
-
68
-
69
-
70
-
71
-
72
-
73
-
74
-
75
-
76
-
77
-
78
-
79
-
80
-
81
-
82
-
83
-
84
-
85
-
86
-
87
-
88
-
89
-
90
-
 91
91 -
 92
92 -
 93
93 -
 94
94 -
 95
95 -
 96
96 -
 97
97 -
 98
98 -
 99
99 -
 100
100 -
 101
101 -
 102
102 -
 103
103 -
 104
104 -
 105
105 -
 106
106 -
 107
107 -
 108
108 -
 109
109 -
 110
110 -
 111
111 -
112
-
113
-
114
-
115
-
116
-
117
-
118
-
119
-
120
-
121
-
122
-
123
-
124
-
125
-
126
-
127
-
128
-
129
-
130
-
131
-
132
-
133
-
134
-
135
-
136
-
137
-
138
-
139
-
140
-
141
-
142
-
143
-
144
-
145
-
146
-
147
-
148
-
149
-
150
-
151
-
152
-
153
-
154
-
155
-
156
-
157
-
158
-
159
-
160
-
161
-
162
-
163
-
164
-
165
-
166
-
167
-
168
-
169
-
170
-
171
-
172
-
173
-
174
-
175
-
176
-
177
-
178
 |
 |

F31
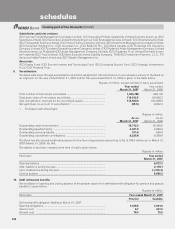
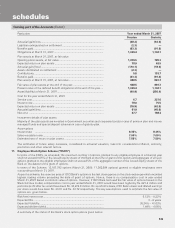
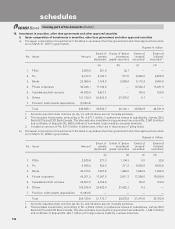
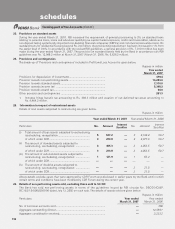
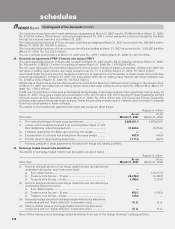
ii) Non-performing investments in securities, other than government and other approved securities
The movement in gross non-performing investments in securities other than government and other approved securities
for the year ended March 31, 2007 and year ended March 31, 2006 is given below.
Rupees in million
Particulars Year ended Year ended
March 31, 2007 March 31, 2006
Opening balance ................................................................................. 2,595.9 8,877.3
Additions during the year .................................................................... 916.1 2,158.0
Reduction during the year ................................................................... (428.9) (8,439.4)
Closing balance ................................................................................... 3,083.1 2,595.9
Total provisions held ........................................................................... 2,045.9 1,509.3
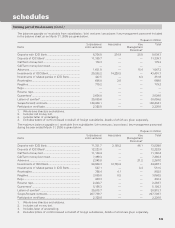
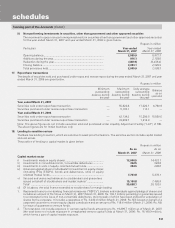
17. Repurchase transactions
The details of securities sold and purchased under repos and reverse repos during the year ended March 31, 2007 and year
ended March 31, 2006 are given below.
Rupees in million
Minimum
outstanding
balance during
the year
Maximum
outstanding
balance during
the year
Daily average
outstanding
balance during
the year
Balance
as on
year end
Year ended March 31, 2007
Securities sold under repurchase transaction — 55,823.8 17,020.1 4,760.6
Securities purchased under reverse repurchase transaction — 5,100.1 110.1 —
Year ended March 31, 2006
Securities sold under repurchase transaction — 43,134.3 15,296.0 10,000.0
Securities purchased under reverse repurchase transaction — 33,608.7 1,214.9 —
Note: The above figures do not include securities sold and purchased under Liquidity Adjustment Facility (‘’LAF”) of RBI.
The above figures are for Indian branches only.
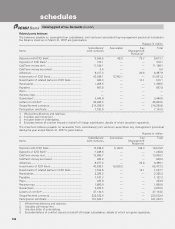
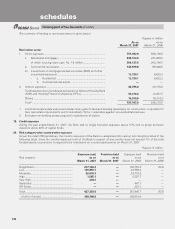
18. Lending to sensitive sectors
The Bank has lending to sectors, which are sensitive to asset price fluctuations. The sensitive sectors include capital market
and real estate.
The position of lending to capital market is given below.
Rupees in million
As on As on
March 31, 2007 March 31, 2006
Capital market sector
i) Investments made in equity shares .................................................... 12,046.5 14,453.1
ii) Investments in convertible bonds / convertible debentures .............. 332.5 583.8
iii) Investments in units of equity–oriented mutual funds ....................... 394.5 200.6
iv) Advances against share to individuals for investment in equity shares
(including IPOs /ESOPs), bonds and debentures, units of equity
oriented mutual funds ......................................................................... 7,763.8 5,470.1
v) Secured and unsecured advances to stockbrokers and guarantees
issued on behalf of stockbrokers and market makers1 ...................... 15,160.8 7,485.9
Total2 .................................................................................................. 35,698.1 28,193.5
vi) Of (v) above, the total finance extended to stockbrokers for margin trading — —
1. Represents loans to non-banking financial companies (“NBFCs”), brokers and individuals against pledge of shares and
includes an amount of Rs. Nil as on March 31, 2007 (March 31, 2006: Rs. 102.7 million) pertaining to guarantee issued
to a corporate for the issue of non-convertible debentures, the proceeds of which have been utilised for acquisition of
shares by the corporate. It includes a guarantee of Rs. 3,040.0 million (March 31, 2006: Rs. Nil) issued on behalf of a
corporate customer to ensure equity capital contribution and an amount of Rs. 118.4 million (March 31, 2006: Rs. Nil)
for issue of guarantee to venture funds.
2. The total does not include exposure in venture capital funds amounting to Rs. 19,499.7 million as of March 31, 2007
(the total does not include exposure in unregistered venture capital funds at March 31, 2006: Rs. 16,149.9 million),
which forms a part of capital market exposure.
forming part of the Accounts (Contd.)
schedules