ICICI Bank 2007 Annual Report Download - page 50
Download and view the complete annual report
Please find page 50 of the 2007 ICICI Bank annual report below. You can navigate through the pages in the report by either clicking on the pages listed below, or by using the keyword search tool below to find specific information within the annual report.-
 1
1 -
2
-
3
-
4
-
5
-
6
-
7
-
8
-
9
-
10
-
11
-
12
-
13
-
14
-
15
-
16
-
17
-
18
-
19
-
20
-
21
-
22
-
23
-
24
-
25
-
26
-
27
-
28
-
29
-
30
-
31
-
32
-
33
-
34
-
35
-
36
-
37
-
38
-
39
-
 40
40 -
 41
41 -
 42
42 -
 43
43 -
 44
44 -
 45
45 -
 46
46 -
 47
47 -
 48
48 -
 49
49 -
 50
50 -
 51
51 -
 52
52 -
 53
53 -
 54
54 -
 55
55 -
 56
56 -
 57
57 -
 58
58 -
 59
59 -
 60
60 -
61
-
62
-
63
-
64
-
65
-
66
-
67
-
68
-
69
-
70
-
71
-
72
-
73
-
74
-
75
-
76
-
77
-
78
-
79
-
80
-
81
-
82
-
83
-
84
-
85
-
86
-
87
-
88
-
89
-
90
-
91
-
92
-
93
-
94
-
95
-
96
-
97
-
98
-
99
-
100
-
101
-
102
-
103
-
104
-
105
-
106
-
107
-
108
-
109
-
110
-
111
-
112
-
113
-
114
-
115
-
116
-
117
-
118
-
119
-
120
-
121
-
122
-
123
-
124
-
125
-
126
-
127
-
128
-
129
-
130
-
131
-
132
-
133
-
134
-
135
-
136
-
137
-
138
-
139
-
140
-
141
-
142
-
143
-
144
-
145
-
146
-
147
-
148
-
149
-
150
-
151
-
152
-
153
-
154
-
155
-
156
-
157
-
158
-
159
-
160
-
161
-
162
-
163
-
164
-
165
-
166
-
167
-
168
-
169
-
170
-
171
-
172
-
173
-
174
-
175
-
176
-
177
-
178
 |
 |

Management’s Discussion & Analysis
48
Management’s Discussion & Analysis
FINANCIALS AS PER INDIAN GAAP
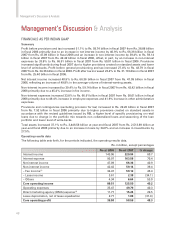
Summary
Profit before provisions and tax increased 51.1% to Rs. 58.74 billion in fiscal 2007 from Rs. 38.88 billion
in fiscal 2006 primarily due to an increase in net interest income by 40.9% to Rs. 66.36 billion in fiscal
2007 from Rs. 47.09 billion in fiscal 2006 and an increase in non-interest income by 39.4% to Rs. 59.14
billion in fiscal 2007 from Rs. 42.42 billion in fiscal 2006, offset, in part, by an increase in non-interest
expenses by 33.8% to Rs. 66.91 billion in fiscal 2007 from Rs. 50.01 billion in fiscal 2006. Provisions
increased significantly during fiscal 2007 due to higher provisions created on standard assets and lower
level of write-backs. Profit before general provisioning and tax increased 27.4% to Rs. 43.79 in fiscal
2007 from Rs. 34.36 billion in fiscal 2006. Profit after tax increased 22.4% to Rs. 31.10 billion in fiscal 2007
from Rs. 25.40 billion in fiscal 2006.
Net interest income increased 40.9% to Rs. 66.36 billion in fiscal 2007 from Rs. 47.09 billion in fiscal
2006, reflecting an increase of 49.8% in the average volume of interest-earning assets.
Non-interest income increased by 39.4% to Rs. 59.14 billion in fiscal 2007 from Rs. 42.42 billion in fiscal
2006 primarily due to a 45.4% increase in fee income.
Non-interest expenses increased 33.8% to Rs. 66.91 billion in fiscal 2007 from Rs. 50.01 billion in fiscal
2006 primarily due to 49.4% increase in employee expenses and 41.9% increase in other administrative
expenses.
Provisions and contingencies (excluding provision for tax) increased to Rs. 22.26 billion in fiscal 2007
from Rs. 7.92 billion in fiscal 2006 primarily due to higher provisions created on standard assets in
accordance with the revised guidelines issued by RBI, a higher level of specific provisioning on retail
loans due to change in the portfolio mix towards non collateralised loans and seasoning of the loan
portfolio and lower level of write-backs.
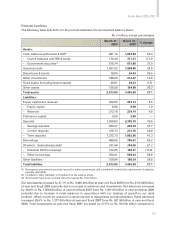
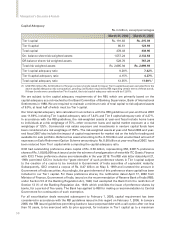
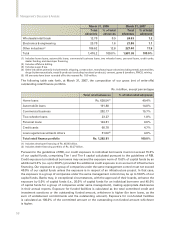
Total assets increased 37.1% to Rs. 3,446.58 billion at year-end fiscal 2007 from Rs. 2,513.89 billion at
year-end fiscal 2006 primarily due to an increase in loans by 34.0% and an increase in investments by
27.5%.
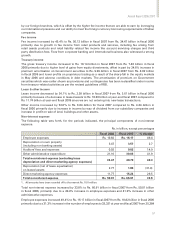
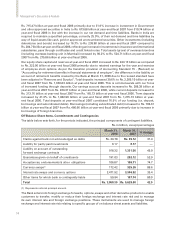
Operating results data
The following table sets forth, for the periods indicated, the operating results data.
Rs. in billion, except percentages
Fiscal 2006 Fiscal 2007 % change
Interest income 143.06 229.94 60.7
Interest expense 95.97 163.58 70.4
Net interest income 47.09 66.36 40.9
Non-interest income 42.42 59.14 39.4
– Fee income(1) 34.47 50.12 45.4
– Lease income 3.61 2.38 (34.1)
– Others 4.34 6.64 53.0
Core operating income 89.51 125.50 40.2
Operating expenses 35.47 49.79 40.3
Direct marketing agency (DMA) expense(2) 11.77 15.24 29.5
Lease depreciation, net of lease equalisation 2.77 1.88 (31.9)
Core operating profit 39.50 58.59 48.3