ICICI Bank 2007 Annual Report Download - page 102
Download and view the complete annual report
Please find page 102 of the 2007 ICICI Bank annual report below. You can navigate through the pages in the report by either clicking on the pages listed below, or by using the keyword search tool below to find specific information within the annual report.-
 1
1 -
2
-
3
-
4
-
5
-
6
-
7
-
8
-
9
-
10
-
11
-
12
-
13
-
14
-
15
-
16
-
17
-
18
-
19
-
20
-
21
-
22
-
23
-
24
-
25
-
26
-
27
-
28
-
29
-
30
-
31
-
32
-
33
-
34
-
35
-
36
-
37
-
38
-
39
-
40
-
41
-
42
-
43
-
44
-
45
-
46
-
47
-
48
-
49
-
50
-
51
-
52
-
53
-
54
-
55
-
56
-
57
-
58
-
59
-
60
-
61
-
62
-
63
-
64
-
65
-
66
-
67
-
68
-
69
-
70
-
71
-
72
-
73
-
74
-
75
-
76
-
77
-
78
-
79
-
80
-
81
-
82
-
83
-
84
-
85
-
86
-
87
-
88
-
89
-
90
-
91
-
 92
92 -
 93
93 -
 94
94 -
 95
95 -
 96
96 -
 97
97 -
 98
98 -
 99
99 -
 100
100 -
 101
101 -
 102
102 -
 103
103 -
 104
104 -
 105
105 -
 106
106 -
 107
107 -
 108
108 -
 109
109 -
 110
110 -
 111
111 -
 112
112 -
113
-
114
-
115
-
116
-
117
-
118
-
119
-
120
-
121
-
122
-
123
-
124
-
125
-
126
-
127
-
128
-
129
-
130
-
131
-
132
-
133
-
134
-
135
-
136
-
137
-
138
-
139
-
140
-
141
-
142
-
143
-
144
-
145
-
146
-
147
-
148
-
149
-
150
-
151
-
152
-
153
-
154
-
155
-
156
-
157
-
158
-
159
-
160
-
161
-
162
-
163
-
164
-
165
-
166
-
167
-
168
-
169
-
170
-
171
-
172
-
173
-
174
-
175
-
176
-
177
-
178
 |
 |

F32
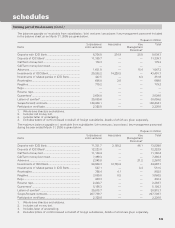
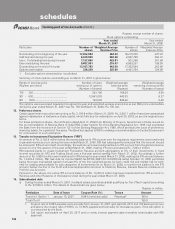
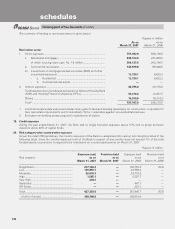
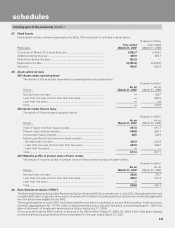
The summary of lending to real estate sector is given below.
Rupees in million
As on As on
March 31, 2007 March 31, 2006
Real estate sector
I. Direct exposure ................................................................................... 751,382.9 508,136.8
i) Residential mortgages, .............................................................. 595,153.0 431,668.5
of which housing loans upto Rs. 1.5 million .............................. 300,137.0 263,796.5
ii) Commercial real estate1 .............................................................. 142,509.8 69,846.0
iii) Investments in mortgage backed securities (MBS) and other
securitised exposures ................................................................. 13,720.1 6,622.2
– a. Residential .................................................................. 13,720.1 6,622.2
– b. Commercial real estate ............................................... — —
II. Indirect exposure ................................................................................ 45,785.0 30,135.8
Fund based and non-fund based exposures on National Housing Bank
(NHB) and Housing Finance Companies (HFCs) ................................. 30,214.4 13,821.5
Others ................................................................................................. 15,570.6 16,314.3
Total2 ................................................................................................... 797,167.9 538,272.5
1. Commercial real estate exposure includes loans given to land and building developers for construction, corporates for
their real estate requirements and to individuals / firms / corporates against non-residential premises.
2. Excludes non-banking assets acquired in satisfaction of claims.
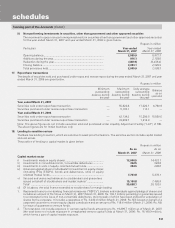
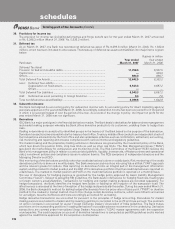
19. Credit exposure
During the year ended March 31, 2007, the Bank had no single borrower exposure above 15% and no group borrower
exposure above 40% of capital funds.
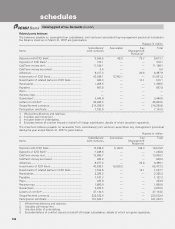
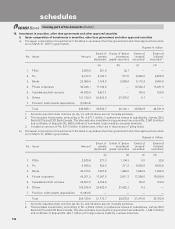
20. Risk category-wise country-wise exposure
As per the extant RBI guidelines, the country exposure of the Bank is categorised into various risk categories listed in the
following table. Since the country exposure (net) of the Bank in respect of any country does not exceed 1% of the total
funded assets, no provision is required to be maintained on country exposures as on March 31, 2007.
Rupees in million
Risk category
Exposure (net)
as on
March 31, 2007
Provision held
as at
March 31, 2007
Exposure (net)
as on
March 31, 2006
Provision held
as at
March 31, 2006
Insignificant ..................................................... 277,784.2 — 118,755.5 63.6
Low .................................................................. 126,883.7 — 44,689.4 —
Moderate ......................................................... 20,616.3 — 24,372.9 —
High ................................................................. 1,565.1 — 3,357.7 —
Very High ......................................................... 404.3 — ——
Restricted ........................................................ ——447.1 —
Off-Credit ......................................................... ——223.1 —
Total ................................................................. 427,253.6 — 191,845.7 63.6
– of which funded ........................................... 308,348.8 — 138,915.0
forming part of the Accounts (Contd.)
schedules