ICICI Bank 2007 Annual Report Download - page 63
Download and view the complete annual report
Please find page 63 of the 2007 ICICI Bank annual report below. You can navigate through the pages in the report by either clicking on the pages listed below, or by using the keyword search tool below to find specific information within the annual report.-
 1
1 -
2
-
3
-
4
-
5
-
6
-
7
-
8
-
9
-
10
-
11
-
12
-
13
-
14
-
15
-
16
-
17
-
18
-
19
-
20
-
21
-
22
-
23
-
24
-
25
-
26
-
27
-
28
-
29
-
30
-
31
-
32
-
33
-
34
-
35
-
36
-
37
-
38
-
39
-
40
-
41
-
42
-
43
-
44
-
45
-
46
-
47
-
48
-
49
-
50
-
51
-
52
-
 53
53 -
 54
54 -
 55
55 -
 56
56 -
 57
57 -
 58
58 -
 59
59 -
 60
60 -
 61
61 -
 62
62 -
 63
63 -
 64
64 -
 65
65 -
 66
66 -
 67
67 -
 68
68 -
 69
69 -
 70
70 -
 71
71 -
 72
72 -
 73
73 -
74
-
75
-
76
-
77
-
78
-
79
-
80
-
81
-
82
-
83
-
84
-
85
-
86
-
87
-
88
-
89
-
90
-
91
-
92
-
93
-
94
-
95
-
96
-
97
-
98
-
99
-
100
-
101
-
102
-
103
-
104
-
105
-
106
-
107
-
108
-
109
-
110
-
111
-
112
-
113
-
114
-
115
-
116
-
117
-
118
-
119
-
120
-
121
-
122
-
123
-
124
-
125
-
126
-
127
-
128
-
129
-
130
-
131
-
132
-
133
-
134
-
135
-
136
-
137
-
138
-
139
-
140
-
141
-
142
-
143
-
144
-
145
-
146
-
147
-
148
-
149
-
150
-
151
-
152
-
153
-
154
-
155
-
156
-
157
-
158
-
159
-
160
-
161
-
162
-
163
-
164
-
165
-
166
-
167
-
168
-
169
-
170
-
171
-
172
-
173
-
174
-
175
-
176
-
177
-
178
 |
 |
61
Annual Report 2006-2007
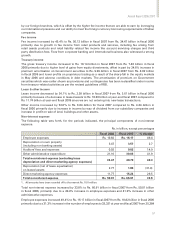
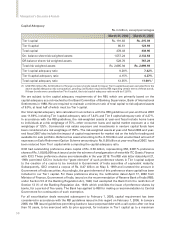
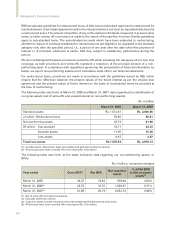
The ratio of net non-performing assets to net customer assets increased to 0.98% at year-end fiscal
2007 compared to 0.71% at year-end fiscal 2006. At year-end fiscal 2007, the gross non-performing
assets (net of write-offs and unpaid interest) were Rs. 41.68 billion compared to Rs. 22.73 billion at year-
end fiscal 2006. Gross of technical write-offs, the gross non-performing assets at year-end fiscal 2007
were Rs. 48.50 billon compared to Rs. 29.63 billion at year-end fiscal 2006. The coverage ratio (i.e. total
provisions and technical write-offs made against non-performing assets as a percentage of gross non-
performing assets) at year-end fiscal 2007 was 58.37% compared to 63.72% at year-end fiscal 2006. In
addition, total general provision made against standard assets was Rs. 12.95 billion at year-end fiscal
2007. Our investments in security receipts issued by Asset Reconstruction Company (India) Limited,
a reconstruction company registered with RBI were Rs. 25.38 billion at year-end fiscal 2007. Our net
restructured standard loans decreased from Rs. 53.16 billion at year-end fiscal 2006 to Rs. 48.83 billion
at year-end fiscal 2007.
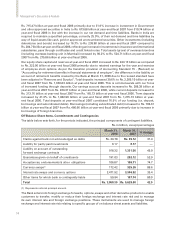
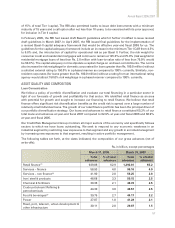
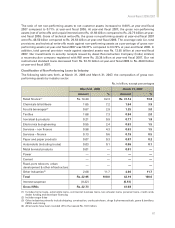
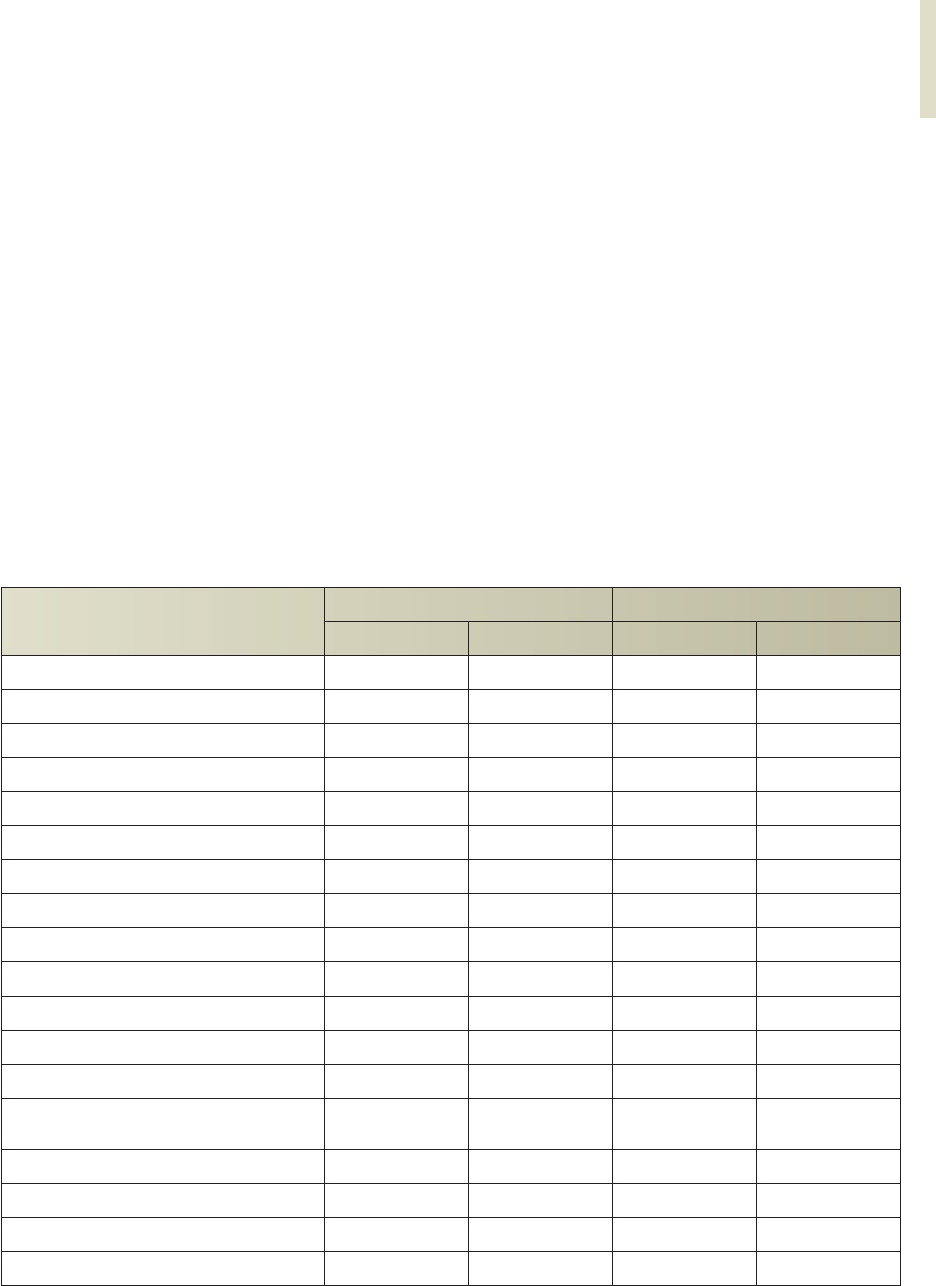
Classification of Non-Performing Loans by Industry
The following table sets forth, at March 31, 2006 and March 31, 2007, the composition of gross non-
performing assets by industry sector.
Rs. in billion, except percentages
March 31, 2006 March 31, 2007
Amount % Amount %
Retail finance(1) Rs. 14.29 62.3 Rs. 31.14 73.8
Chemicals & fertilisers 1.65 7.2 1.64 3.9
Food & beverages(2) 0.67 2.9 1.25 3.0
Textiles 1.68 7.3 0.84 2.0
Iron/steel & products 0.21 0.9 0.77 1.8
Electronics & engineering 0.55 2.4 0.63 1.5
Services – non finance 0.98 4.3 0.63 1.5
Services – finance 0.13 0.6 0.19 0.5
Paper and paper products 0.07 0.3 0.07 0.2
Automobile (including trucks) 0.03 0.1 0.06 0.1
Metal & metal products 0.01 — 0.01 —
Power — — ——
Cement — — ——
Road, port, telecom, urban
development & other infrastructure ————
Other Industries(3) 2.68 11.7 4.96 11.7
Total Rs. 22.95 100.0 42.19 100.0
Interest suspense (0.22) (0.51)
Gross NPAs Rs. 22.73 41.68
(1) Includes home loans, automobile loans, commercial business loans, two wheeler loans, personal loans, credit cards,
dealer funding and developer financing
(2) Includes sugar & tea
(3) Other industries primarily include shipping, construction, crude petroleum, drugs & pharmaceuticals, gems & jewellery,
FMCG and mining.
(4) All amounts have been rounded off to the nearest Rs. 10.0 million.