Foot Locker 2007 Annual Report Download - page 78
Download and view the complete annual report
Please find page 78 of the 2007 Foot Locker annual report below. You can navigate through the pages in the report by either clicking on the pages listed below, or by using the keyword search tool below to find specific information within the annual report.-
 1
1 -
2
-
3
-
4
-
5
-
6
-
7
-
8
-
9
-
10
-
11
-
12
-
13
-
14
-
15
-
16
-
17
-
18
-
19
-
20
-
21
-
22
-
23
-
24
-
25
-
26
-
27
-
28
-
29
-
30
-
31
-
32
-
33
-
34
-
35
-
36
-
37
-
38
-
39
-
40
-
41
-
42
-
43
-
44
-
45
-
46
-
47
-
48
-
49
-
50
-
51
-
52
-
53
-
54
-
55
-
56
-
57
-
58
-
59
-
60
-
61
-
62
-
63
-
64
-
65
-
66
-
67
-
 68
68 -
 69
69 -
 70
70 -
 71
71 -
 72
72 -
 73
73 -
 74
74 -
 75
75 -
 76
76 -
 77
77 -
 78
78 -
 79
79 -
 80
80 -
 81
81 -
 82
82 -
 83
83 -
 84
84 -
 85
85 -
 86
86 -
 87
87 -
 88
88 -
89
-
90
-
91
-
92
-
93
-
94
-
95
-
96
 |
 |

62
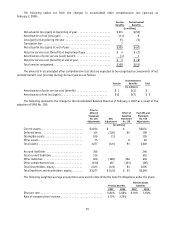
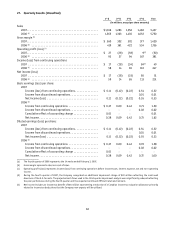
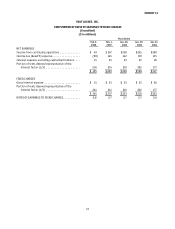
27. Quarterly Results (Unaudited)
1st Q 2nd Q 3rd Q 4th Q Year
(in millions, except per share amounts)
Sales
2007.............................................. $1,316 1,283 1,356 1,482 5,437
2006 (a) ........................................... 1,365 1,303 1,430 1,652 5,750
Gross margin (b)
2007.............................................. $ 360 302 381 377 1,420
2006 (a) ........................................... 419 361 422 534 1,736
Operating profit (loss) (c)
2007.............................................. $ 27 (28) (58) 9(d) (50)
2006 (a) ........................................... 93 27 94 167 381
Income (loss) from continuing operations
2007 ............................................. $ 17 (18) (34) 84(e) 49
2006 (a) ........................................... 58 14 65 110 247
Net income (loss)
2007 ............................................. $ 17 (18) (33) 85 51
2006 (a) ........................................... 59 14 65 113 251
Basic earnings (loss) per share:
2007
Income (loss) from continuing operations............... $ 0.11 (0.12) (0.22) 0.540.32
Income from discontinued operations .................. — — — 0.01 0.01
Net income (loss) ................................. 0.11 (0.12) (0.22) 0.550.33
2006 (a)
Income from continuing operations ................... $ 0.37 0.09 0.42 0 .71 1.59
Income from discontinued operations .................. — — — 0.02 0.02
Cumulative effect of accounting change ................ 0.01 — — — 0.01
Net income . . . . . . . . . . . . . . . . . . . . . . . . . . . . . . . . . . . . . . 0.38 0.09 0.42 0.73 1.62
Diluted earnings (loss) per share:
2007
Income (loss) from continuing operations............... $ 0.11 (0.12) (0.22) 0.540.32
Income from discontinued operations .................. — — — 0.01 0.01
Net income (loss) ................................. 0.11 (0.12) (0.22) 0.550.33
2006 (a)
Income from continuing operations ................... $ 0.37 0.09 0.42 0.70 1.58
Income from discontinued operations .................. — — — 0.02 0.02
Cumulative effect of accounting change ................ 0.01 — — — —
Net income . . . . . . . . . . . . . . . . . . . . . . . . . . . . . . . . . . . . . . 0.38 0.09 0.42 0.72 1.60
(a) The fourth quarter of 2006 represents the 14 weeks ended February 3, 2007.
(b) Gross margin represents sales less cost of sales.
(c) Operating profit (loss) represents income (loss) from continuing operations before income taxes, interest expense, net and non-operating
income.
(d) During the fourth quarter of 2007, the Company recognized an additional impairment charge of $22 million reflecting the continued
downturn of the U.S. formats. The projected cash flows used in the third quarter impairment analysis were significantly reduced reflecting
the poor performance during the fourth quarter and the expected continued difficult retail environment.
(e) Net income includes an income tax benefit of $65 million representing a reduction of a Canadian income tax valuation allowance primarily
related to income tax deductions that the Company now expects will be utilized.