Foot Locker 2007 Annual Report Download - page 29
Download and view the complete annual report
Please find page 29 of the 2007 Foot Locker annual report below. You can navigate through the pages in the report by either clicking on the pages listed below, or by using the keyword search tool below to find specific information within the annual report.-
 1
1 -
2
-
3
-
4
-
5
-
6
-
7
-
8
-
9
-
10
-
11
-
12
-
13
-
14
-
15
-
16
-
17
-
18
-
 19
19 -
 20
20 -
 21
21 -
 22
22 -
 23
23 -
 24
24 -
 25
25 -
 26
26 -
 27
27 -
 28
28 -
 29
29 -
 30
30 -
 31
31 -
 32
32 -
 33
33 -
 34
34 -
 35
35 -
 36
36 -
 37
37 -
 38
38 -
 39
39 -
40
-
41
-
42
-
43
-
44
-
45
-
46
-
47
-
48
-
49
-
50
-
51
-
52
-
53
-
54
-
55
-
56
-
57
-
58
-
59
-
60
-
61
-
62
-
63
-
64
-
65
-
66
-
67
-
68
-
69
-
70
-
71
-
72
-
73
-
74
-
75
-
76
-
77
-
78
-
79
-
80
-
81
-
82
-
83
-
84
-
85
-
86
-
87
-
88
-
89
-
90
-
91
-
92
-
93
-
94
-
95
-
96
 |
 |

13
Other Income
In 2007, other income included a $1 million gain related to a final settlement with the Company’s insurance
carriers of a claim related to a store damaged by a fire in 2006. Additionally, the Company sold two of its lease interests
in Europe for a gain of $1 million. These gains were offset primarily by premiums paid for foreign currency option
contracts. The 2006 amounts included a net gain of $4 million from the termination of two of the Company’s leases for
approximately $5 million and insurance claims related to Hurricane Katrina that resulted in a gain of $8 million, which
represented amounts in excess of losses. Also during 2006, the Company purchased and retired $38 million of long-term
debt at a discount from face value of $2 million.
Income Taxes
The effective tax rate for 2007 was a benefit of 198.0 percent as compared with an expense of 36.9 percent in the
prior year. The change in the rate is primarily due to the $65 million valuation allowance adjustment (net of deferred
costs) relating to Canadian tax depreciation and tax loss carryforwards, the change in the mix of U.S. and international
profits, and the impairment charges relating to the Company’s U.S. operations.
The effective tax rate for 2006 was 36.9 percent as compared with 35.0 percent in the prior year. The increase
in the rate is primarily due to the change in the mix of U.S. and international profits and the $17 million impairment
charge relating to the Company’s European operations, as well as a $6 million valuation allowance adjustment recorded
in 2005.
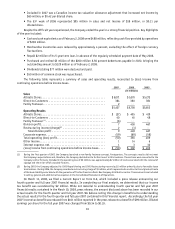
Segment Information
The Company evaluates performance based on several factors, the primary financial measure of which is division
profit. Division profit (loss) reflects income (loss) from continuing operations before income taxes, corporate expense,
non-operating income, and net interest expense.
Athletic Stores
2007 2006 2005
(in millions)
Sales . . . . . . . . . . . . . . . . . . . . . . . . . . . . . . . . . . . . . . . . . . . . . $ 5,071 $5,370 $5,272
Division (loss) profit . . . . . . . . . . . . . . . . . . . . . . . . . . . . . . . . . $ (27) $ 405 $ 419
Sales as a percentage of consolidated total . . . . . . . . . . . . . . . . 93%93%93%
Division (loss) profit margin . . . . . . . . . . . . . . . . . . . . . . . . . . . (0.5)% 7.5%7.9%
Number of stores at year end . . . . . . . . . . . . . . . . . . . . . . . . . . . 3,785 3,942 3,921
Selling square footage (in millions) . . . . . . . . . . . . . . . . . . . . . . 8.50 8.74 8.71
Gross square footage (in millions) . . . . . . . . . . . . . . . . . . . . . . . 14.12 14.55 14.48
2007 compared with 2006
Athletic Stores sales of $5,071 million decreased 5.6 percent in 2007, as compared with $5,370 million in 2006.
Excluding the effect of foreign currency fluctuations, primarily related to the euro, sales from athletic store formats
decreased by 7.8 percent in 2007. The decline in sales for the year ended February 2, 2008 was primarily related to the
domestic operations. Sales in the U.S. were negatively affected by a continuing weakening in consumer spending,
unseasonable warmer weather, and a lack of clear fashion trend in athletic footwear and apparel. Internationally,
comparable-store sales declined mid-single digits. In Europe, sales of low-profile footwear styles declined, while the
sales trend of higher priced technical footwear was higher than the prior year. Comparable-store sales for the Athletic
Stores segment decreased by 6.6 percent in 2007.
Athletic Stores reported a loss of $27 million in 2007 as compared with a profit of $405 million in 2006. The
decrease in division profit was attributable to the U.S operations. The decline in the U.S. operations was offset, in
part, by increases in most international formats. Included in the Athletic Stores division results for 2007 are non-cash
impairment charges of $117 million to write-down long-lived assets such as store fixtures and leasehold improvements for
1,395 stores at the Company’s U.S. store operations pursuant to SFAS No. 144, consistent with the Company’s recoverability
of long-lived assets policy. Additionally, in 2007, the Company identified unproductive stores for closure; accordingly,