Foot Locker 2007 Annual Report Download - page 26
Download and view the complete annual report
Please find page 26 of the 2007 Foot Locker annual report below. You can navigate through the pages in the report by either clicking on the pages listed below, or by using the keyword search tool below to find specific information within the annual report.-
 1
1 -
2
-
3
-
4
-
5
-
6
-
7
-
8
-
9
-
10
-
11
-
12
-
13
-
14
-
15
-
 16
16 -
 17
17 -
 18
18 -
 19
19 -
 20
20 -
 21
21 -
 22
22 -
 23
23 -
 24
24 -
 25
25 -
 26
26 -
 27
27 -
 28
28 -
 29
29 -
 30
30 -
 31
31 -
 32
32 -
 33
33 -
 34
34 -
 35
35 -
 36
36 -
37
-
38
-
39
-
40
-
41
-
42
-
43
-
44
-
45
-
46
-
47
-
48
-
49
-
50
-
51
-
52
-
53
-
54
-
55
-
56
-
57
-
58
-
59
-
60
-
61
-
62
-
63
-
64
-
65
-
66
-
67
-
68
-
69
-
70
-
71
-
72
-
73
-
74
-
75
-
76
-
77
-
78
-
79
-
80
-
81
-
82
-
83
-
84
-
85
-
86
-
87
-
88
-
89
-
90
-
91
-
92
-
93
-
94
-
95
-
96
 |
 |

10
• Included in 2007 was a Canadian income tax valuation allowance adjustment that increased net income by
$65 million, or $0.42 per diluted share.
• The 53rd week of 2006 represented $95 million in sales and net income of $18 million, or $0.11 per
diluted share.
Despite the difficult year experienced, the Company ended the year in a strong financial position. Key highlights
of the year included:
• Cash and cash equivalents as of February 2, 2008 were $488 million, reflecting cash flow provided by operations
of $283 million.
• Merchandise inventories were reduced by approximately 4 percent, excluding the effect of foreign currency
fluctuations.
• Repaid $2 million of its 5-year term loan, in advance of the regularly scheduled payment date of May 2008.
• Purchased and retired $5 million of the $200 million 8.50 percent debentures payable in 2022, bringing the
outstanding amount to $129 million as of February 2, 2008.
• Dividends totaling $77 million were declared and paid.
• $50 million of common stock was repurchased.
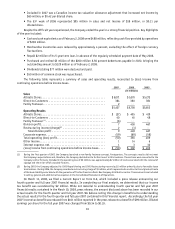
The following table represents a summary of sales and operating results, reconciled to (loss) income from
continuing operations before income taxes.
2007 2006 2005
(in millions)
Sales
Athletic Stores. . . . . . . . . . . . . . . . . . . . . . . . . . . . . . . . . . . . . . . . . $5,071 $5,370 $5,272
Direct-to-Customers . . . . . . . . . . . . . . . . . . . . . . . . . . . . . . . . . . . . 364 380 381
Family Footwear. . . . . . . . . . . . . . . . . . . . . . . . . . . . . . . . . . . . . . . . 2 — —
$5,437 $5,750 $5,653
Operating Results
Athletic Stores. . . . . . . . . . . . . . . . . . . . . . . . . . . . . . . . . . . . . . . . . $ (27) $ 405 $ 419
Direct-to-Customers . . . . . . . . . . . . . . . . . . . . . . . . . . . . . . . . . . . . 40 45 48
Family Footwear (1) . . . . . . . . . . . . . . . . . . . . . . . . . . . . . . . . . . . . . . (6) — —
Division profit . . . . . . . . . . . . . . . . . . . . . . . . . . . . . . . . . . . . . . . . . 7 450 467
Restructuring income (charge)(2) . . . . . . . . . . . . . . . . . . . . . . . . . . . 2 (1) —
Total division profit . . . . . . . . . . . . . . . . . . . . . . . . . . . . . . . . . . 9 449 467
Corporate expense. . . . . . . . . . . . . . . . . . . . . . . . . . . . . . . . . . . . . . (59) (68) (58)
Total operating (loss) profit. . . . . . . . . . . . . . . . . . . . . . . . . . . . . . . (50) 381 409
Other income. . . . . . . . . . . . . . . . . . . . . . . . . . . . . . . . . . . . . . . . . . 1 14 6
Interest expense, net. . . . . . . . . . . . . . . . . . . . . . . . . . . . . . . . . . . . 1 3 10
(Loss) income from continuing operations before income taxes . . . . $ (50) $ 392 $ 405
(1) During the first quarter of 2007, the Company launched a new family footwear concept, Footquarters. The concept’s results did not meet
the Company’s expectations and, therefore, the Company decided not to further invest in this business. These stores were converted to the
Company’s other formats. Included in the operating loss of $6 million, was approximately $2 million of costs associated with the removal of
signage and the write-off of unusable fixtures.
(2) During 2007, the Company adjusted its 1993 Repositioning and 1991 Restructuring reserve by $2 million primarily due to favorable lease
terminations. During 2006, the Company recorded a restructuring charge of $1 million, which represented a revision to the original estimate
of the lease liability associated with the guarantee of The San Francisco Music Box Company distribution center. These amounts are included
in selling, general and administrative expenses in the Consolidated Statements of Operations.
On March 11, 2008, we filed a Current Report on Form 8-K, which included a press release announcing our
fourth quarter and full year 2007 financial results. In completing our final analysis, we determined that our income
tax benefit was overstated by $2 million. While not material to understanding fourth quarter and full year 2007
financial results contained in the March 10, 2008, press release, the amount disclosed above has been recorded in our
actual results for the fourth quarter and full year 2007. We believe noting this change is beneficial to understanding
the actual results for the fourth quarter and full year 2007 contained in this financial report. Accordingly, the full year
2007 income tax benefit was reduced from $101 million reported in the press release to a benefit of $99 million. Diluted
earnings per share for the full year 2007 was changed from $0.34 to $0.33.