Foot Locker 2007 Annual Report Download - page 28
Download and view the complete annual report
Please find page 28 of the 2007 Foot Locker annual report below. You can navigate through the pages in the report by either clicking on the pages listed below, or by using the keyword search tool below to find specific information within the annual report.-
 1
1 -
2
-
3
-
4
-
5
-
6
-
7
-
8
-
9
-
10
-
11
-
12
-
13
-
14
-
15
-
16
-
17
-
 18
18 -
 19
19 -
 20
20 -
 21
21 -
 22
22 -
 23
23 -
 24
24 -
 25
25 -
 26
26 -
 27
27 -
 28
28 -
 29
29 -
 30
30 -
 31
31 -
 32
32 -
 33
33 -
 34
34 -
 35
35 -
 36
36 -
 37
37 -
 38
38 -
39
-
40
-
41
-
42
-
43
-
44
-
45
-
46
-
47
-
48
-
49
-
50
-
51
-
52
-
53
-
54
-
55
-
56
-
57
-
58
-
59
-
60
-
61
-
62
-
63
-
64
-
65
-
66
-
67
-
68
-
69
-
70
-
71
-
72
-
73
-
74
-
75
-
76
-
77
-
78
-
79
-
80
-
81
-
82
-
83
-
84
-
85
-
86
-
87
-
88
-
89
-
90
-
91
-
92
-
93
-
94
-
95
-
96
 |
 |

12
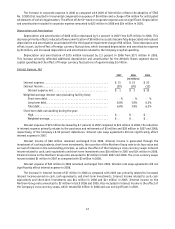
The increase in corporate expense in 2006 as compared with 2005 of $10 million reflects the adoption of SFAS
No. 123(R) that resulted in incremental compensation expense of $6 million and a charge of $4 million for anticipated
settlements of certain legal matters. The effect of the 53rd week on corporate expense was not significant. Depreciation
and amortization included in corporate expense amounted to $22 million in 2006 and $24 million in 2005.
Depreciation and Amortization
Depreciation and amortization of $166 million decreased by 5.1 percent in 2007 from $175 million in 2006. This
decrease primarily reflects reduced software amortization of $8 million as assets became fully depreciated and reduced
depreciation and amortization associated with the third quarter impairment charge of $8 million. These decreases were
offset, in part, by the effect of foreign currency fluctuations, which increased depreciation and amortization expense
by $3 million, and increased depreciation and amortization related to the Company’s capital spending.
Depreciation and amortization of $175 million increased by 2.3 percent in 2006 from $171 million in 2005.
This increase primarily reflected additional depreciation and amortization for the Athletic Stores segment due to
capital spending and the effect of foreign currency fluctuations of approximately $1 million.
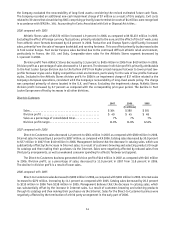
Interest Expense, Net
2007 2006 2005
(in millions)
Interest expense . . . . . . . . . . . . . . . . . . . . . . . . . . . . . . . . . . . . . . . . . $ 21 $23 $23
Interest income. . . . . . . . . . . . . . . . . . . . . . . . . . . . . . . . . . . . . . . . . . (20) (20) (13)
Interest expense, net . . . . . . . . . . . . . . . . . . . . . . . . . . . . . . . . . . . $ 1 $ 3 $ 10
Weighted-average interest rate (excluding facility fees):
Short-term debt . . . . . . . . . . . . . . . . . . . . . . . . . . . . . . . . . . . . . . . —% —% —%
Long-term debt. . . . . . . . . . . . . . . . . . . . . . . . . . . . . . . . . . . . . . . . 6.8% 7.8% 6.2%
Total debt. . . . . . . . . . . . . . . . . . . . . . . . . . . . . . . . . . . . . . . . . . . . 6.8% 7.8% 6.2%
Short-term debt outstanding during the year:
High. . . . . . . . . . . . . . . . . . . . . . . . . . . . . . . . . . . . . . . . . . . . . . . . $ — $ — $ —
Weighted-average. . . . . . . . . . . . . . . . . . . . . . . . . . . . . . . . . . . . . . $ — $ — $ —
Interest expense of $21 million decreased by 8.7 percent in 2007 compared to $23 million in 2006. The reduction
in interest expense primarily relates to the purchases and retirements of $5 million and $38 million in 2007 and 2006,
respectively, of the Company’s 8.50 percent debentures. Interest rate swap agreements did not significantly affect
interest expense in 2007.
Interest income of $20 million remained unchanged from 2006. Interest income is generated through the
investment of cash equivalents, short-term investments, the accretion of the Northern Group note to its face value and
accrual of interest on the outstanding principal, as well as the effect of the Company’s cross currency swaps. Interest
income related to cash, cash equivalents and short-term investments was $16 million in 2007 and $14 million in 2006.
Interest income on the Northern Group note amounted to $2 million in both 2007 and 2006. The cross currency swaps
income totaled $1 million in 2007 as compared with $3 million in 2006.
Interest expense of $23 million in 2006 remained unchanged from 2005. Interest rate swap agreements did not
significantly affect interest expense in 2006.
The increase in interest income of $7 million in 2006 as compared with 2005 was primarily related to increased
interest income earned on cash, cash equivalents, and short-term investments. Interest income related to cash, cash
equivalents and short-term investments was $14 million in 2006 and $11 million in 2005. Interest income on the
Northern Group note amounted to $2 million in both 2006 and 2005. Also included in interest income is the effect of
the Company’s cross currency swaps, which totaled $3 million in 2006 and was not significant in 2005.