Foot Locker 2007 Annual Report Download - page 23
Download and view the complete annual report
Please find page 23 of the 2007 Foot Locker annual report below. You can navigate through the pages in the report by either clicking on the pages listed below, or by using the keyword search tool below to find specific information within the annual report.-
 1
1 -
2
-
3
-
4
-
5
-
6
-
7
-
8
-
9
-
10
-
11
-
12
-
 13
13 -
 14
14 -
 15
15 -
 16
16 -
 17
17 -
 18
18 -
 19
19 -
 20
20 -
 21
21 -
 22
22 -
 23
23 -
 24
24 -
 25
25 -
 26
26 -
 27
27 -
 28
28 -
 29
29 -
 30
30 -
 31
31 -
 32
32 -
 33
33 -
34
-
35
-
36
-
37
-
38
-
39
-
40
-
41
-
42
-
43
-
44
-
45
-
46
-
47
-
48
-
49
-
50
-
51
-
52
-
53
-
54
-
55
-
56
-
57
-
58
-
59
-
60
-
61
-
62
-
63
-
64
-
65
-
66
-
67
-
68
-
69
-
70
-
71
-
72
-
73
-
74
-
75
-
76
-
77
-
78
-
79
-
80
-
81
-
82
-
83
-
84
-
85
-
86
-
87
-
88
-
89
-
90
-
91
-
92
-
93
-
94
-
95
-
96
 |
 |
7
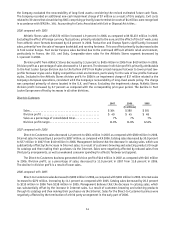
Performance Graph
The following graph compares the cumulative five-year total return to shareholders on Foot Locker, Inc.’s common
stock relative to the total returns of the Russell 2000 Index and a selected peer group, which represents its peers as
retailers in the athletic footwear and apparel industry. The peer group comprises:
• Dick’s Sporting Goods, Inc.
• TheFinishLine,Inc.
• HibbettSportingGoods,Inc.,and
• Genesco,Inc.,whosebusinessincludesoperationsoutsideoftheathleticfootwearandapparelretailing.
0
50
100
150
200
250
300
350
Jan-03 Jan-04 Jan-05 Jan-06 Feb-07 Feb-08
Russel 2000 Peer Group
Foot Locker, Inc.
Indexed Share Price Performance
(%)
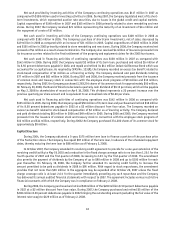
The Company has historically constructed a selected peer group in its performance graph. However, due to the
declining number of public company peers in the athletic footwear and apparel industry, the Company has determined
it would be more appropriate to use the S&P 400 Retailing Index, rather than the selected peer group. The next graph
compares the cumulative five-year total shareholder return on our common stock against the cumulative five-year total
return of the S&P 400 Retailing Index and the Russell 2000 Index.
Indexed Share Price Performance
0
50
100
150
200
250
300
350
Jan-03 Jan-04 Jan-05 Jan-06 Feb-07 Feb-08
(%)
S&P 400 Retailing Index Russel 2000
Foot Locker, Inc.