Food Lion 2011 Annual Report Download - page 98
Download and view the complete annual report
Please find page 98 of the 2011 Food Lion annual report below. You can navigate through the pages in the report by either clicking on the pages listed below, or by using the keyword search tool below to find specific information within the annual report.-
 1
1 -
2
-
3
-
4
-
5
-
6
-
7
-
8
-
9
-
10
-
11
-
12
-
13
-
14
-
15
-
16
-
17
-
18
-
19
-
20
-
21
-
22
-
23
-
24
-
25
-
26
-
27
-
28
-
29
-
30
-
31
-
32
-
33
-
34
-
35
-
36
-
37
-
38
-
39
-
40
-
41
-
42
-
43
-
44
-
45
-
46
-
47
-
48
-
49
-
50
-
51
-
52
-
53
-
54
-
55
-
56
-
57
-
58
-
59
-
60
-
61
-
62
-
63
-
64
-
65
-
66
-
67
-
68
-
69
-
70
-
71
-
72
-
73
-
74
-
75
-
76
-
77
-
78
-
79
-
80
-
81
-
82
-
83
-
84
-
85
-
86
-
87
-
 88
88 -
 89
89 -
 90
90 -
 91
91 -
 92
92 -
 93
93 -
 94
94 -
 95
95 -
 96
96 -
 97
97 -
 98
98 -
 99
99 -
 100
100 -
 101
101 -
 102
102 -
 103
103 -
 104
104 -
 105
105 -
 106
106 -
 107
107 -
 108
108 -
109
-
110
-
111
-
112
-
113
-
114
-
115
-
116
-
117
-
118
-
119
-
120
-
121
-
122
-
123
-
124
-
125
-
126
-
127
-
128
-
129
-
130
-
131
-
132
-
133
-
134
-
135
-
136
-
137
-
138
-
139
-
140
-
141
-
142
-
143
-
144
-
145
-
146
-
147
-
148
-
149
-
150
-
151
-
152
-
153
-
154
-
155
-
156
-
157
-
158
-
159
-
160
-
161
-
162
-
163
-
164
-
165
-
166
-
167
-
168
 |
 |

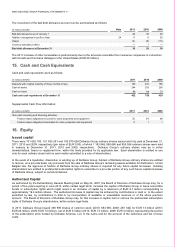
96 // DELHAIZE GROUP FINANCIAL STATEMENTS ’11
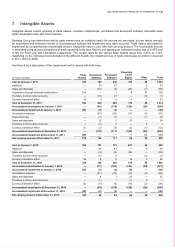
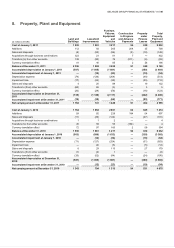
(in millions of EUR)
Land and
Buildings
Leasehold
Improvements
Furniture,
Fixtures,
Equipment
and
Vehicles
Construction
in Progress
and Advance
Payments
Property
under
Finance
Leases
Total
Property,
Plant and
Equipment
Cost at January 1. 2009
1 604
1 593
2 892
97
839
7 025
Additions
73
64
205
115
66
523
Sales and disposals
(6)
(27)
(89)
—
(19)
(141)
Acquisitions through business combinations
3
8
3
—
—
14
Transfers (to) from other accounts(1)
123
58
(47)
(149)
(15)
(30)
Currency translation effect
(33)
(44)
(73)
(1)
(26)
(177)
Balance at December 31, 2009
1 764
1 652
2 891
62
845
7 214
Accumulated depreciation at January 1, 2009
(398)
(820)
(1 595)
—
(317)
(3 130)
Accumulated impairment at January 1, 2009
—
(13)
(33)
—
(17)
(63)
Depreciation expense
(56)
(122)
(226)
—
(49)
(453)
Impairment loss
(1)
(5)
(7)
—
—
(13)
Sales and disposals
3
25
84
—
19
131
Transfers to (from) other accounts(1)
(60)
(1)
68
—
7
14
Currency translation effect
9
23
42
—
11
85
Accumulated depreciation at December 31,
2009
(503) (899) (1 633) — (330) (3 365)
Accumulated impairment at December 31, 2009
— (14) (34) — (16) (64)
Net carrying amount at December 31, 2009
1 261
739
1 224
62
499
3 785
_______________
(1) During 2009 certain permanent building fixtures were transferred from “Furniture, fixtures, equipment and vehicles” to “Land and Buildings.”
Depreciation expense is included in the following line items of the income statement:
(in millions of EUR) 2011 2010 2009
Cost of sales
56
56
44
Selling, general and administrative expenses 457 447 409
Total depreciation
513
503
453
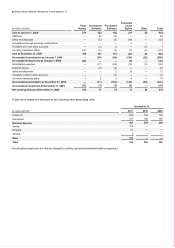
Property, plant and equipment can be summarized by reportable segment as follows:
(in millions of EUR)
December 31,
2011 2010 2009
United States 2 750 2 794 2 596
Belgium 808 784 764
Southeastern Europe and Asia 988 488 415
Corporate 9 9 10
Total property, plant and equipment 4 555 4 075 3 785
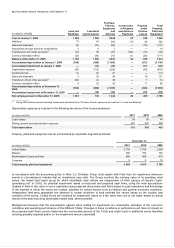
In accordance with the accounting policy in Note 2.3, Delhaize Group tests assets with finite lives for impairment whenever
events or circumstances indicate that an impairment may exist. The Group monitors the carrying value of its operating retail
stores, the lowest level asset group for which identifiable cash inflows are independent of other (groups of) assets (“cash-
generating unit” or CGU), for potential impairment based on historical and projected cash flows, using the main assumptions
detailed in Note 6: the value in use is estimated using projected discounted cash flows based on past experience and knowledge
of the markets in which the stores are located, adjusted for various factors such as inflation and general economic conditions.
Independent third-party appraisals are obtained in certain situations to help estimate fair values based on the location and
condition of the stores. Closed stores are reviewed for impairment based on a fair value less cost to sell basis, based on actual
results of the past and using observable market data, where possible.
Management believes that the assumptions applied when testing for impairment are reasonable estimates of the economic
conditions and operating performance of the different CGUs. Changes in these conditions or performance will have an impact on
the projected cash flows used to determine the recoverable amount of the CGUs and might result in additional stores identified
as being possibly impaired and/or on the impairment amount calculated.