Food Lion 2011 Annual Report Download - page 64
Download and view the complete annual report
Please find page 64 of the 2011 Food Lion annual report below. You can navigate through the pages in the report by either clicking on the pages listed below, or by using the keyword search tool below to find specific information within the annual report.-
 1
1 -
2
-
3
-
4
-
5
-
6
-
7
-
8
-
9
-
10
-
11
-
12
-
13
-
14
-
15
-
16
-
17
-
18
-
19
-
20
-
21
-
22
-
23
-
24
-
25
-
26
-
27
-
28
-
29
-
30
-
31
-
32
-
33
-
34
-
35
-
36
-
37
-
38
-
39
-
40
-
41
-
42
-
43
-
44
-
45
-
46
-
47
-
48
-
49
-
50
-
51
-
52
-
53
-
 54
54 -
 55
55 -
 56
56 -
 57
57 -
 58
58 -
 59
59 -
 60
60 -
 61
61 -
 62
62 -
 63
63 -
 64
64 -
 65
65 -
 66
66 -
 67
67 -
 68
68 -
 69
69 -
 70
70 -
 71
71 -
 72
72 -
 73
73 -
 74
74 -
75
-
76
-
77
-
78
-
79
-
80
-
81
-
82
-
83
-
84
-
85
-
86
-
87
-
88
-
89
-
90
-
91
-
92
-
93
-
94
-
95
-
96
-
97
-
98
-
99
-
100
-
101
-
102
-
103
-
104
-
105
-
106
-
107
-
108
-
109
-
110
-
111
-
112
-
113
-
114
-
115
-
116
-
117
-
118
-
119
-
120
-
121
-
122
-
123
-
124
-
125
-
126
-
127
-
128
-
129
-
130
-
131
-
132
-
133
-
134
-
135
-
136
-
137
-
138
-
139
-
140
-
141
-
142
-
143
-
144
-
145
-
146
-
147
-
148
-
149
-
150
-
151
-
152
-
153
-
154
-
155
-
156
-
157
-
158
-
159
-
160
-
161
-
162
-
163
-
164
-
165
-
166
-
167
-
168
 |
 |

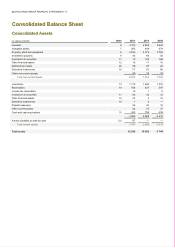
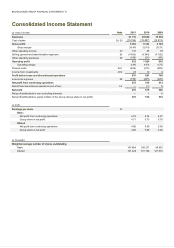
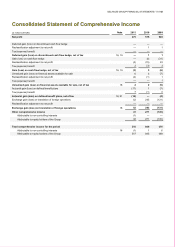
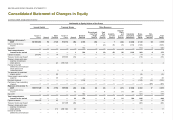
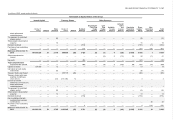
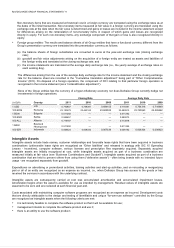
62 // DELHAIZE GROUP FINANCIAL STATEMENTS ’11
Consolidated Balance Sheet
Consolidated Assets
(in millions of EUR) Note 2011 2010 2009
Goodwill
6
3 373
2 828
2 640
Intangible assets
7
855
634
574
Property, plant and equipment
8
4 555
4 075
3 785
Investment property
9
85
60
50
Investment in securities
11
13
125
126
Other financial assets
12
18
17
16
Deferred tax assets
22
96
95
23
Derivative instruments
19
57
61
96
Other non-current assets 23 19 19
Total non-current assets 9 075 7 914 7 329
Inventories
13
1 718
1 460
1 278
Receivables
14
706
637
597
Income tax receivables
10
1
8
Investment in securities
11
93
43
12
Other financial assets
12
22
3
15
Derivative instruments
19
1
5
—
Prepaid expenses
56
44
33
Other current assets
42
37
37
Cash and cash equivalents 15 432
758
439
3 080
2 988
2 419
Assets classified as held for sale 5.2 87
—
—
Total current assets 3 167 2 988 2 419
Total assets
12 242
10 902
9 748