Food Lion 2011 Annual Report Download - page 129
Download and view the complete annual report
Please find page 129 of the 2011 Food Lion annual report below. You can navigate through the pages in the report by either clicking on the pages listed below, or by using the keyword search tool below to find specific information within the annual report.-
 1
1 -
2
-
3
-
4
-
5
-
6
-
7
-
8
-
9
-
10
-
11
-
12
-
13
-
14
-
15
-
16
-
17
-
18
-
19
-
20
-
21
-
22
-
23
-
24
-
25
-
26
-
27
-
28
-
29
-
30
-
31
-
32
-
33
-
34
-
35
-
36
-
37
-
38
-
39
-
40
-
41
-
42
-
43
-
44
-
45
-
46
-
47
-
48
-
49
-
50
-
51
-
52
-
53
-
54
-
55
-
56
-
57
-
58
-
59
-
60
-
61
-
62
-
63
-
64
-
65
-
66
-
67
-
68
-
69
-
70
-
71
-
72
-
73
-
74
-
75
-
76
-
77
-
78
-
79
-
80
-
81
-
82
-
83
-
84
-
85
-
86
-
87
-
88
-
89
-
90
-
91
-
92
-
93
-
94
-
95
-
96
-
97
-
98
-
99
-
100
-
101
-
102
-
103
-
104
-
105
-
106
-
107
-
108
-
109
-
110
-
111
-
112
-
113
-
114
-
115
-
116
-
117
-
118
-
 119
119 -
 120
120 -
 121
121 -
 122
122 -
 123
123 -
 124
124 -
 125
125 -
 126
126 -
 127
127 -
 128
128 -
 129
129 -
 130
130 -
 131
131 -
 132
132 -
 133
133 -
 134
134 -
 135
135 -
 136
136 -
 137
137 -
 138
138 -
 139
139 -
140
-
141
-
142
-
143
-
144
-
145
-
146
-
147
-
148
-
149
-
150
-
151
-
152
-
153
-
154
-
155
-
156
-
157
-
158
-
159
-
160
-
161
-
162
-
163
-
164
-
165
-
166
-
167
-
168
 |
 |

DELHAIZE GROUP FINANCIAL STATEMENTS ’11 // 127
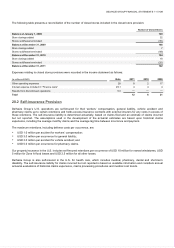
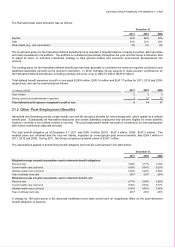
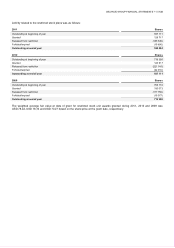
The Hannaford plan asset allocation was as follows:
December 31,
2011 2010 2009
Equities
49%
66%
63%
Debt
49%
32%
29%
Other assets (e.g., cash equivalents)
2%
2%
8%
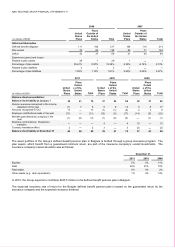
The investment policy for the Hannaford defined benefit plan is to maintain a targeted balance of equity securities, debt securities
and cash equivalents in its portfolio. The portfolio is re-balanced periodically throughout the year and the Group is therefore able
to adjust its short- to mid-term investment strategy to take general market and economic environment developments into
account.
The funding policy for the Hannaford defined benefit plan has been generally to contribute the minimum required contribution and
additional deductible amounts at the sponsor’s discretion. In 2012, Delhaize Group expects to make pension contributions for
the Hannaford defined benefit plan, including voluntary amounts, of up to USD 10 million (EUR 8 million).
Total defined benefit expenses in profit or loss equal EUR 6 million, EUR 14 million and EUR 17 million for 2011, 2010 and 2009,
respectively, and can be summarized as follows:
(in millions of EUR) 2011 2010 2009
Cost of sales
2
2
2
Selling, general and administrative expenses 4 12 15
Total defined benefit expense recognized in profit or loss
6
14
17
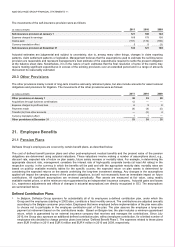
21.2 Other Post-Employment Benefits
Hannaford and Sweetbay provide certain health care and life insurance benefits for retired employees, which qualify as a defined
benefit plan. Substantially all Hannaford employees and certain Sweetbay employees may become eligible for these benefits,
however, currently a very limited number is covered. The post-employment health care plan is contributory for most participants
with retiree contributions adjusted annually.
The total benefit obligation as of December 31, 2011 was EUR 3 million (2010: EUR 3 million, 2009: EUR 2 million). The
medical plans are unfunded and the total net liability, impacted by unrecognized past service benefits, was EUR 3 million in
2011, 2010 and 2009. During 2011, the Group recognized actuarial losses of EUR 1 million.
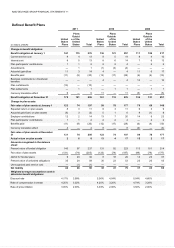
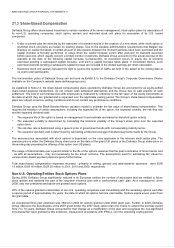
The assumptions applied in determining benefit obligation and cost are summarized in the table below:
December 31,
2011 2010 2009
Weighted-average actuarial assumptions used to determine benefit obligations:
Discount rate
3.80%
4.77%
5.38%
Current health care cost trend
9.09%
9.00%
9.25%
Ultimate health care cost trend
5.00%
5.00%
5.00%
Year of ultimate trend rate
2017
2017
2016
Weighted-average actuarial assumptions used to determine benefit cost:
Discount rate
4.77%
5.38%
5.80%
Current health care cost trend
9.00%
9.25%
9.77%
Ultimate health care cost trend
5.00%
5.00%
5.00%
Year of ultimate trend rate
2017
2016
2015
A change by 100 basis points in the assumed healthcare trend rates would have an insignificant effect on the post-retirement
benefit obligation or expense.