Food Lion 2011 Annual Report Download - page 4
Download and view the complete annual report
Please find page 4 of the 2011 Food Lion annual report below. You can navigate through the pages in the report by either clicking on the pages listed below, or by using the keyword search tool below to find specific information within the annual report.-
 1
1 -
 2
2 -
 3
3 -
 4
4 -
 5
5 -
 6
6 -
 7
7 -
 8
8 -
 9
9 -
 10
10 -
 11
11 -
 12
12 -
 13
13 -
 14
14 -
 15
15 -
16
-
17
-
18
-
19
-
20
-
21
-
22
-
23
-
24
-
25
-
26
-
27
-
28
-
29
-
30
-
31
-
32
-
33
-
34
-
35
-
36
-
37
-
38
-
39
-
40
-
41
-
42
-
43
-
44
-
45
-
46
-
47
-
48
-
49
-
50
-
51
-
52
-
53
-
54
-
55
-
56
-
57
-
58
-
59
-
60
-
61
-
62
-
63
-
64
-
65
-
66
-
67
-
68
-
69
-
70
-
71
-
72
-
73
-
74
-
75
-
76
-
77
-
78
-
79
-
80
-
81
-
82
-
83
-
84
-
85
-
86
-
87
-
88
-
89
-
90
-
91
-
92
-
93
-
94
-
95
-
96
-
97
-
98
-
99
-
100
-
101
-
102
-
103
-
104
-
105
-
106
-
107
-
108
-
109
-
110
-
111
-
112
-
113
-
114
-
115
-
116
-
117
-
118
-
119
-
120
-
121
-
122
-
123
-
124
-
125
-
126
-
127
-
128
-
129
-
130
-
131
-
132
-
133
-
134
-
135
-
136
-
137
-
138
-
139
-
140
-
141
-
142
-
143
-
144
-
145
-
146
-
147
-
148
-
149
-
150
-
151
-
152
-
153
-
154
-
155
-
156
-
157
-
158
-
159
-
160
-
161
-
162
-
163
-
164
-
165
-
166
-
167
-
168
 |
 |
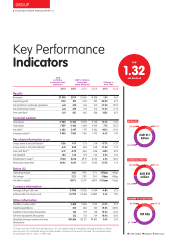
Key Performance
Indicators
(USD
in millions
except per share
amounts)
(4)
(EUR in millions
except per
share amounts)
Change vs
Prior Year
2011 2011 2010 2009 2011 2010
Results
Revenues
29 398 21 119 20 850 19 938 1.3% 4.6%
Operating profit
1 130 812 1 024 942 -20.8% 8.7%
Net profit from continuing operations
661 475 576 512 -17.5% 12.5%
Net profit (Group share)
661 475 574 514 -17.4% 11.7%
Free cash flow(1)
-321 -231 665 626 -135% 6.5%
Financial position
Total assets
17 040 12 242 10 902 9 748 12.3% 11.8%
Total equity
7 559 5 430 5 069 4 409 7.1% 15.0%
Net debt(1)
3 683 2 647 1 787 2 063 48.1% -13.4%
Enterprise value(1)(3)
9 840 7 069 7 400 7 472 -4.5% -1.0%
Per share information (in EUR)
Group share in net profit (basic)(2)
6.56 4.71 5.73 5.16 -17.7% 11.2%
Group share in net profit (diluted)(2)
6.51 4.68 5.68 5.08 -17.6% 11.7%
Free cash flow(1)(2)
-3.19 -2.29 6.64 6.26 -135% 6.0%
Net dividend
1.84 1.32 1.29 1.20 2.3% 7.5%
Shareholders’ equity(3)
74.00 53.16 49.91 43.54 6.5% 14.6%
Share price (year-end)
60.43 43.41 55.27 53.62 -21.5% 3.1%
Ratios (%)
Operating margin
3.8% 4.9% 4.7% -107bps +19bps
Net margin
2.2% 2.8% 2.6% -51bps +18bps
Net debt to equity(1)
48.7% 35.3% 46.8% +13.5ppt -11.5ppt
Currency information
Average EUR per USD rate
0.7184 0.7543 0.7169 -4.8% 5.2%
EUR per USD rate at year-end
0.7729 0.7484 0.6942 3.3% 7.8%
Other information
Number of sales outlets
3 408 2 800 2 732 21.7% 2.5%
Capital expenditures
762 660 520 15.5% 26.8%
Number of associates (thousands)
160 139 138 15.3% +0.4%
Full-time equivalents (thousands)
122 103 104 18.0% -0.8%
Weighted average number of shares
(thousands)
100 684 100 271 99 803 0.4% 0.5%
(1) These are non-GAAP financial measures. (2) Calculated using the weighted average number of shares
over the year. (3) Calculated using the total number of shares at the end of the year. (4) Calculated using
an exchange rate of 1 EUR = 1.3920 USD.
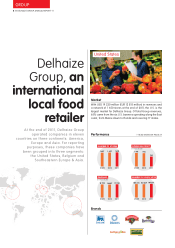
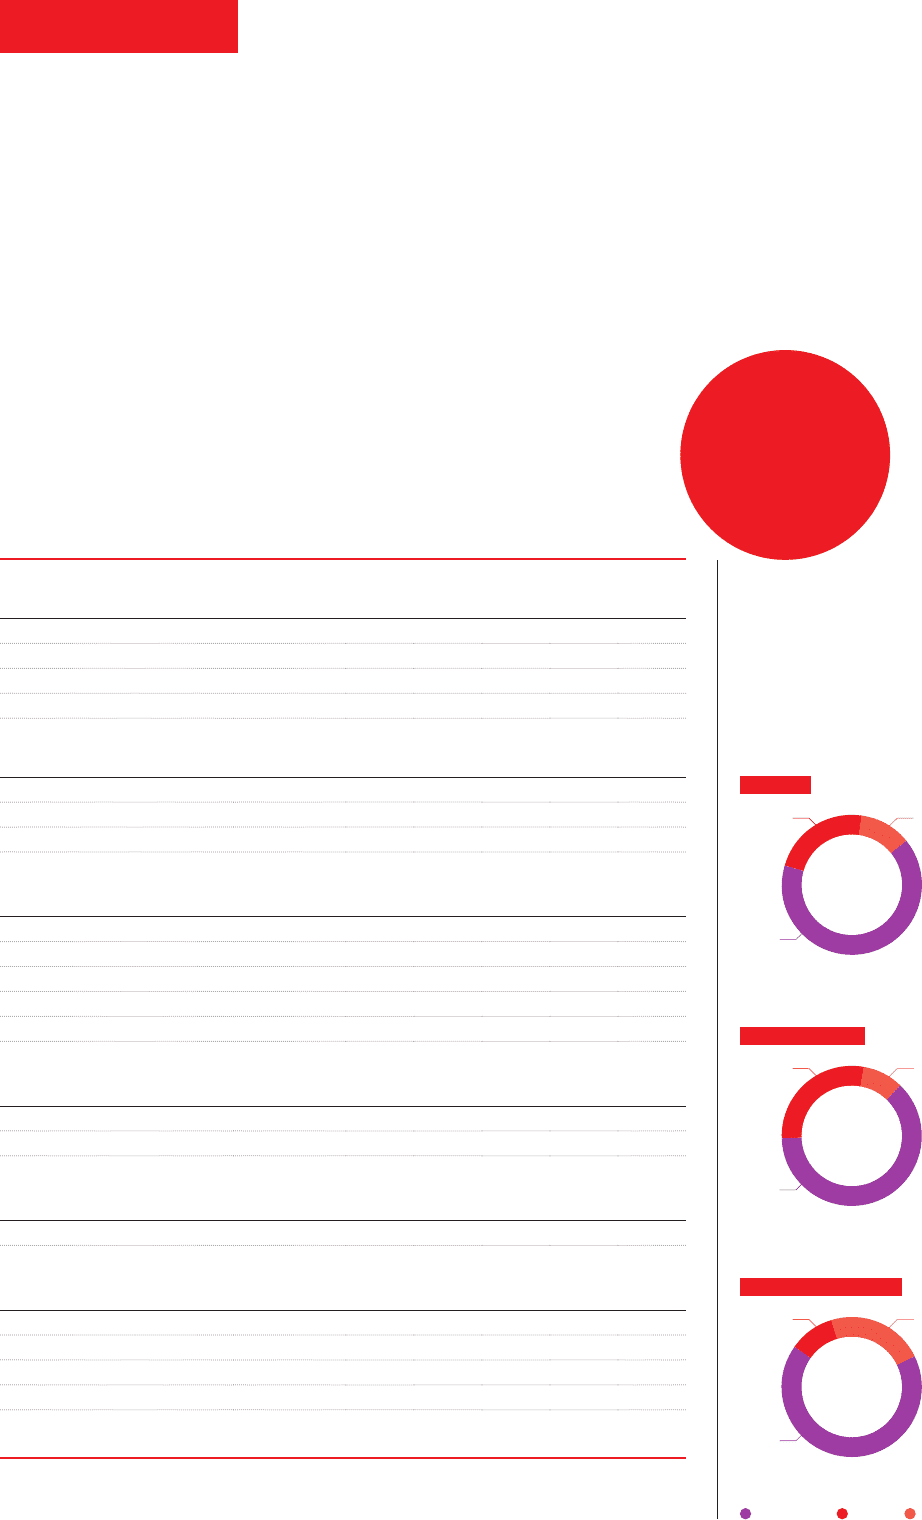
United States Belgium SEE & Asia
EUR
1.32
net dividend
11.6%
23.0%
65.4%
REVENUES
EUR 21.1
billion
OPERATING PROFIT
9.4%28.3%
62.3%
EUR 812
million
22.3%10.6%
67.1%
NUMBER OF ASSOCIATES
159 856
GROUP
2 // DELHAIZE GROUP ANNUAL REPORT ‘11