Food Lion 2011 Annual Report Download - page 153
Download and view the complete annual report
Please find page 153 of the 2011 Food Lion annual report below. You can navigate through the pages in the report by either clicking on the pages listed below, or by using the keyword search tool below to find specific information within the annual report.-
 1
1 -
2
-
3
-
4
-
5
-
6
-
7
-
8
-
9
-
10
-
11
-
12
-
13
-
14
-
15
-
16
-
17
-
18
-
19
-
20
-
21
-
22
-
23
-
24
-
25
-
26
-
27
-
28
-
29
-
30
-
31
-
32
-
33
-
34
-
35
-
36
-
37
-
38
-
39
-
40
-
41
-
42
-
43
-
44
-
45
-
46
-
47
-
48
-
49
-
50
-
51
-
52
-
53
-
54
-
55
-
56
-
57
-
58
-
59
-
60
-
61
-
62
-
63
-
64
-
65
-
66
-
67
-
68
-
69
-
70
-
71
-
72
-
73
-
74
-
75
-
76
-
77
-
78
-
79
-
80
-
81
-
82
-
83
-
84
-
85
-
86
-
87
-
88
-
89
-
90
-
91
-
92
-
93
-
94
-
95
-
96
-
97
-
98
-
99
-
100
-
101
-
102
-
103
-
104
-
105
-
106
-
107
-
108
-
109
-
110
-
111
-
112
-
113
-
114
-
115
-
116
-
117
-
118
-
119
-
120
-
121
-
122
-
123
-
124
-
125
-
126
-
127
-
128
-
129
-
130
-
131
-
132
-
133
-
134
-
135
-
136
-
137
-
138
-
139
-
140
-
141
-
142
-
 143
143 -
 144
144 -
 145
145 -
 146
146 -
 147
147 -
 148
148 -
 149
149 -
 150
150 -
 151
151 -
 152
152 -
 153
153 -
 154
154 -
 155
155 -
 156
156 -
 157
157 -
 158
158 -
 159
159 -
 160
160 -
 161
161 -
 162
162 -
 163
163 -
164
-
165
-
166
-
167
-
168
 |
 |

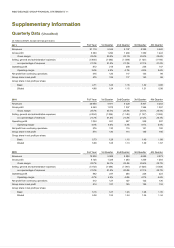
DELHAIZE GROUP FINANCIAL STATEMENTS ’11 // 151
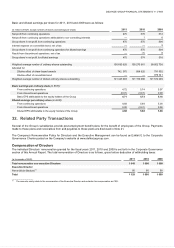
Results at Identical Exchange Rates
(in millions of EUR, except per share amounts) 2011 2010 2011/2010
At Actual
Rates
Effect of
Exchange
Rates
At
Identical
Rates At Actual Rates
At Actual
Rates
At
Identical
Rates
Revenues 21 119 693 21 812 20 850 +1.3% +4.6%
Operating profit 812 26 838 1 024 -20.8% -18.1%
Net profit from continuing operations 475 13 488 576 -17.5% -15.1%
Group share in net profit 475 13 488 574 -17.4% -14.9%
Basic earnings from Group share in net profit 4.71 0.14 4.85 5.73 -17.7% -15.3%
Diluted earnings from Group share in net profit 4.68 0.14 4.82 5.68 -17.6% -15.2%
Free cash flow (231) 28 (203) 665 -134.7% -130.6%
(in millions of EUR) December 31, 2011 December 31, 2010 Change
Net debt 2 647 (15) 2 632 1 787 +48.1% +47.3%