Food Lion 2011 Annual Report Download - page 103
Download and view the complete annual report
Please find page 103 of the 2011 Food Lion annual report below. You can navigate through the pages in the report by either clicking on the pages listed below, or by using the keyword search tool below to find specific information within the annual report.-
 1
1 -
2
-
3
-
4
-
5
-
6
-
7
-
8
-
9
-
10
-
11
-
12
-
13
-
14
-
15
-
16
-
17
-
18
-
19
-
20
-
21
-
22
-
23
-
24
-
25
-
26
-
27
-
28
-
29
-
30
-
31
-
32
-
33
-
34
-
35
-
36
-
37
-
38
-
39
-
40
-
41
-
42
-
43
-
44
-
45
-
46
-
47
-
48
-
49
-
50
-
51
-
52
-
53
-
54
-
55
-
56
-
57
-
58
-
59
-
60
-
61
-
62
-
63
-
64
-
65
-
66
-
67
-
68
-
69
-
70
-
71
-
72
-
73
-
74
-
75
-
76
-
77
-
78
-
79
-
80
-
81
-
82
-
83
-
84
-
85
-
86
-
87
-
88
-
89
-
90
-
91
-
92
-
 93
93 -
 94
94 -
 95
95 -
 96
96 -
 97
97 -
 98
98 -
 99
99 -
 100
100 -
 101
101 -
 102
102 -
 103
103 -
 104
104 -
 105
105 -
 106
106 -
 107
107 -
 108
108 -
 109
109 -
 110
110 -
 111
111 -
 112
112 -
 113
113 -
114
-
115
-
116
-
117
-
118
-
119
-
120
-
121
-
122
-
123
-
124
-
125
-
126
-
127
-
128
-
129
-
130
-
131
-
132
-
133
-
134
-
135
-
136
-
137
-
138
-
139
-
140
-
141
-
142
-
143
-
144
-
145
-
146
-
147
-
148
-
149
-
150
-
151
-
152
-
153
-
154
-
155
-
156
-
157
-
158
-
159
-
160
-
161
-
162
-
163
-
164
-
165
-
166
-
167
-
168
 |
 |
DELHAIZE GROUP FINANCIAL STATEMENTS ’11 // 101
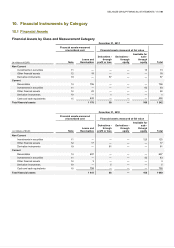
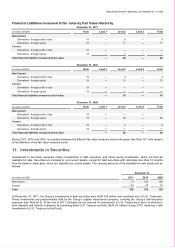
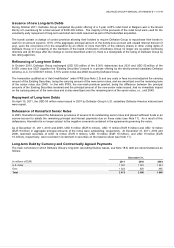
December 31, 2010
(in millions of EUR) Note Level 1 Level 2 Level 3 Total
Non-Current
Available for sale - through equity 11 122 3 — 125
Derivatives - through profit or loss 19 — 61 — 61
Derivatives - through equity 19 — — — —
Current
Available for sale - through equity 11 43 — — 43
Derivatives - through profit or loss 19 — 5 — 5
Derivatives - through equity 19 — — — —
Total financial assets measured at fair value 165 69 — 234
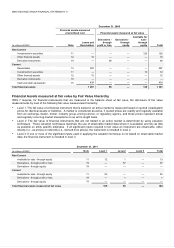
December 31, 2009
(in millions of EUR) Note Level 1 Level 2 Level 3 Total
Non-Current
Available for sale - through equity
11
124
2
—
126
Derivatives - through profit or loss
19
—
96
—
96
Derivatives - through equity
19
—
—
—
—
Current
Available for sale - through equity
11
12
—
—
12
Derivatives - through profit or loss
19
—
—
—
—
Derivatives - through equity 19 — — — —
Total financial assets measured at fair value 136 98 — 234
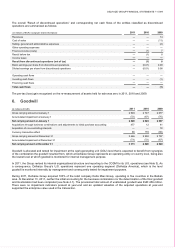
During 2010 EUR 1 million of securities were transferred from Level 2 to Level 1. No transfers between the different fair value
hierarchy levels took place in 2011 and 2009.
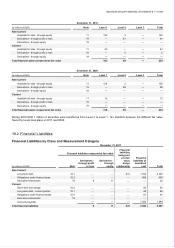
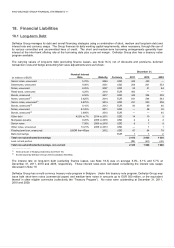
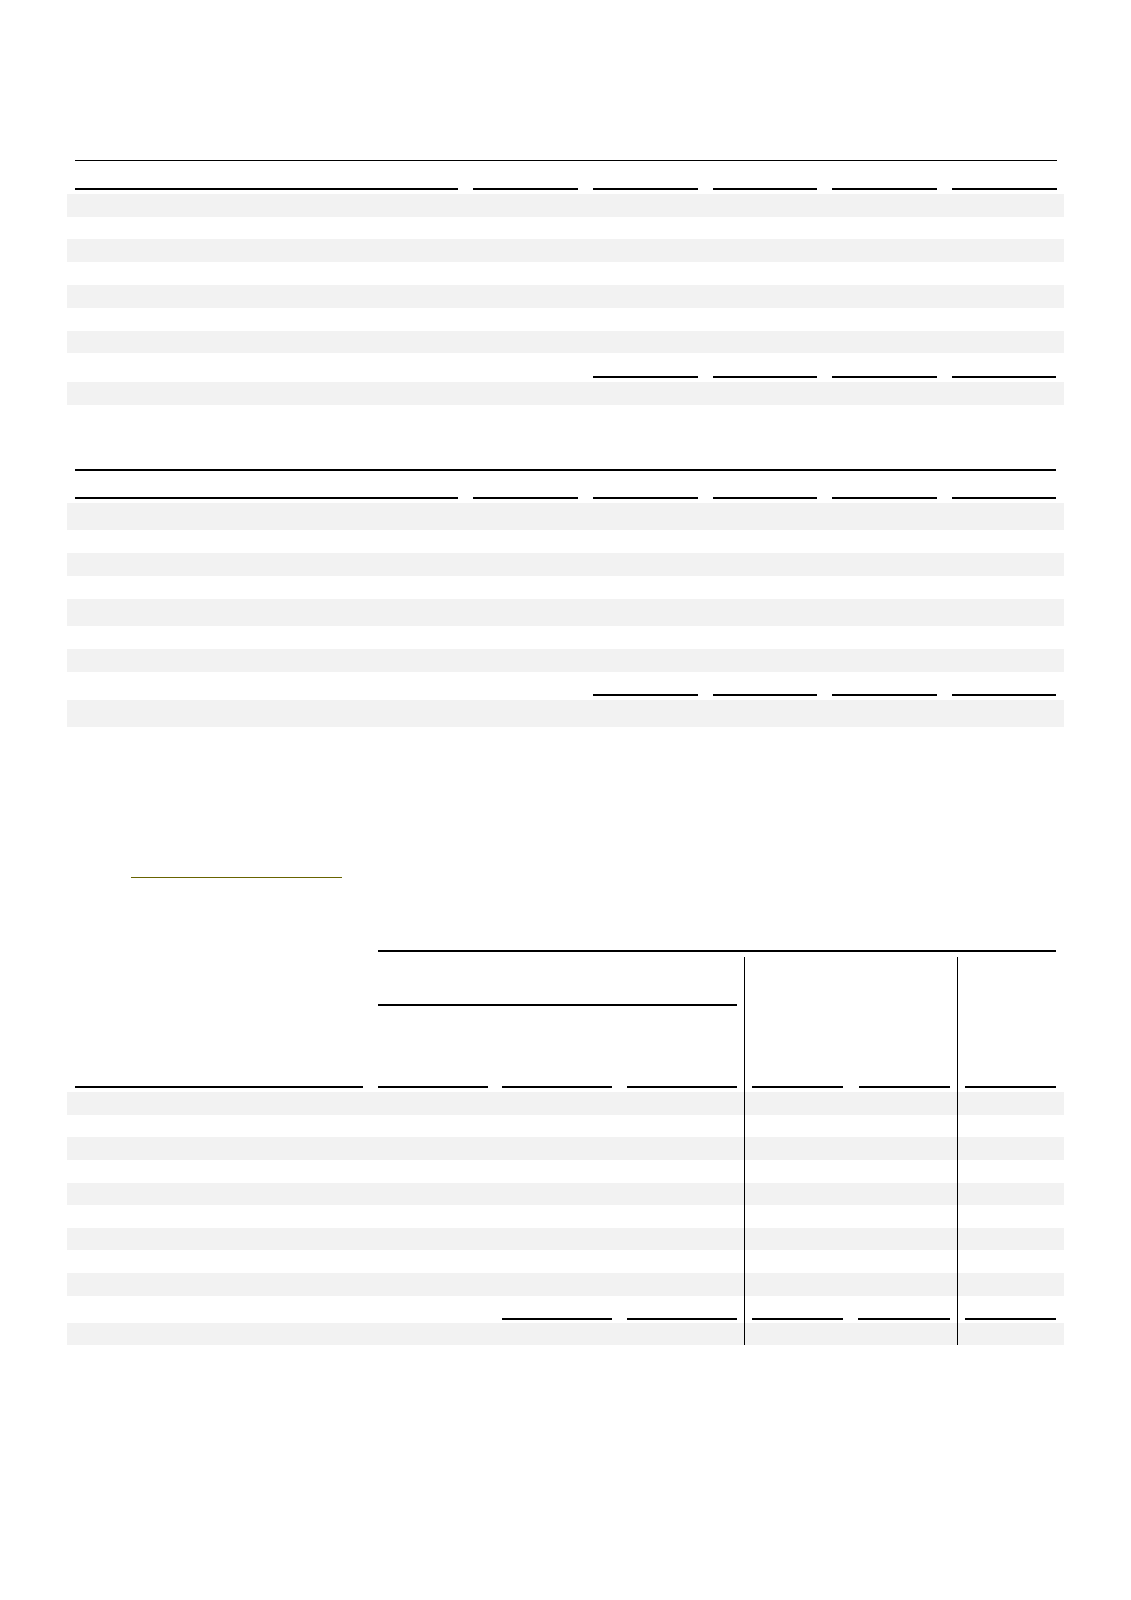
10.2 Financial Liabilities
Financial Liabilities by Class and Measurement Category
December 31, 2011
(in millions of EUR)
Financial liabilities measured at fair value
Financial
liabilities
being part
of a fair
value
hedge
relationship
Financial
liabilities at
amortized
cost Total
Note
Derivatives -
through profit
or loss
Derivatives -
through
equity
Non-Current
Long-term debt 18.1
—
—
541 1 784 2 325
Obligations under finance lease 18.3
—
—
—
689 689
Derivative instruments 19 9 11
—
—
20
Current
Short-term borrowings 18.2
—
—
—
60 60
Long-term debt - current portion 18.1
—
—
—
88 88
Obligations under finance leases 18.3
—
—
—
61 61
Derivative instruments 19
—
—
—
—
—
Accounts payable — — — 1 844 1 844
Total financial liabilities 9 11 541 4 526 5 087