Food Lion 2011 Annual Report Download - page 65
Download and view the complete annual report
Please find page 65 of the 2011 Food Lion annual report below. You can navigate through the pages in the report by either clicking on the pages listed below, or by using the keyword search tool below to find specific information within the annual report.-
 1
1 -
2
-
3
-
4
-
5
-
6
-
7
-
8
-
9
-
10
-
11
-
12
-
13
-
14
-
15
-
16
-
17
-
18
-
19
-
20
-
21
-
22
-
23
-
24
-
25
-
26
-
27
-
28
-
29
-
30
-
31
-
32
-
33
-
34
-
35
-
36
-
37
-
38
-
39
-
40
-
41
-
42
-
43
-
44
-
45
-
46
-
47
-
48
-
49
-
50
-
51
-
52
-
53
-
54
-
 55
55 -
 56
56 -
 57
57 -
 58
58 -
 59
59 -
 60
60 -
 61
61 -
 62
62 -
 63
63 -
 64
64 -
 65
65 -
 66
66 -
 67
67 -
 68
68 -
 69
69 -
 70
70 -
 71
71 -
 72
72 -
 73
73 -
 74
74 -
 75
75 -
76
-
77
-
78
-
79
-
80
-
81
-
82
-
83
-
84
-
85
-
86
-
87
-
88
-
89
-
90
-
91
-
92
-
93
-
94
-
95
-
96
-
97
-
98
-
99
-
100
-
101
-
102
-
103
-
104
-
105
-
106
-
107
-
108
-
109
-
110
-
111
-
112
-
113
-
114
-
115
-
116
-
117
-
118
-
119
-
120
-
121
-
122
-
123
-
124
-
125
-
126
-
127
-
128
-
129
-
130
-
131
-
132
-
133
-
134
-
135
-
136
-
137
-
138
-
139
-
140
-
141
-
142
-
143
-
144
-
145
-
146
-
147
-
148
-
149
-
150
-
151
-
152
-
153
-
154
-
155
-
156
-
157
-
158
-
159
-
160
-
161
-
162
-
163
-
164
-
165
-
166
-
167
-
168
 |
 |

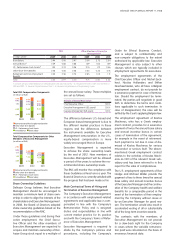
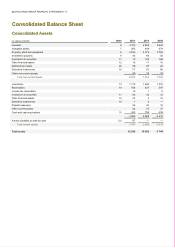
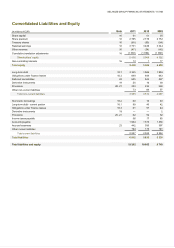
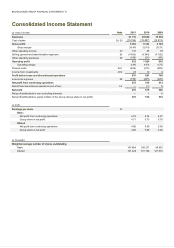
DELHAIZE GROUP FINANCIAL STATEMENTS ’11 // 63
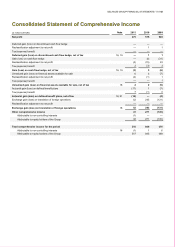
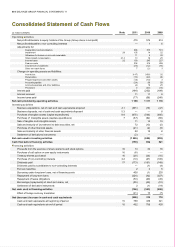
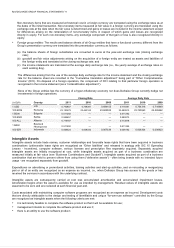
Consolidated Liabilities and Equity
(in millions of EUR) Note 2011 2010 2009
Share capital
16
51
51
50
Share premium
16
2 785
2 778
2 752
Treasury shares
16
(65)
(59)
(54)
Retained earnings
16
3 731
3 426
3 044
Other reserves
16
(47)
(34)
(40)
Cumulative translation adjustments 16 (1 039) (1 094) (1 360)
Shareholders’ equity 5 416 5 068 4 392
Non-controlling interests 16 14 1 17
Total equity
5 430
5 069
4 409
Long-term debt
18.1
2 325
1 966
1 904
Obligations under finance leases
18.3
689
684
643
Deferred tax liabilities
22
625
543
227
Derivative instruments
19
20
16
38
Provisions
20, 21
253
233
228
Other non-current liabilities 73 68 57
Total non-current liabilities 3 985 3 510 3 097
Short-term borrowings
18.2
60
16
63
Long-term debt - current portion
18.1
88
40
42
Obligations under finance leases
18.3
61
57
44
Derivative instruments
19
—
—
2
Provisions
20, 21
82
52
52
Income taxes payable
56
17
65
Accounts payable
1 844
1 574
1 436
Accrued expenses
23
442
393
397
Other current liabilities 194 174 141
Total current liabilities 2 827 2 323 2 242
Total liabilities
6 812
5 833
5 339
Total liabilities and equity
12 242
10 902
9 748