Food Lion 2011 Annual Report Download - page 127
Download and view the complete annual report
Please find page 127 of the 2011 Food Lion annual report below. You can navigate through the pages in the report by either clicking on the pages listed below, or by using the keyword search tool below to find specific information within the annual report.-
 1
1 -
2
-
3
-
4
-
5
-
6
-
7
-
8
-
9
-
10
-
11
-
12
-
13
-
14
-
15
-
16
-
17
-
18
-
19
-
20
-
21
-
22
-
23
-
24
-
25
-
26
-
27
-
28
-
29
-
30
-
31
-
32
-
33
-
34
-
35
-
36
-
37
-
38
-
39
-
40
-
41
-
42
-
43
-
44
-
45
-
46
-
47
-
48
-
49
-
50
-
51
-
52
-
53
-
54
-
55
-
56
-
57
-
58
-
59
-
60
-
61
-
62
-
63
-
64
-
65
-
66
-
67
-
68
-
69
-
70
-
71
-
72
-
73
-
74
-
75
-
76
-
77
-
78
-
79
-
80
-
81
-
82
-
83
-
84
-
85
-
86
-
87
-
88
-
89
-
90
-
91
-
92
-
93
-
94
-
95
-
96
-
97
-
98
-
99
-
100
-
101
-
102
-
103
-
104
-
105
-
106
-
107
-
108
-
109
-
110
-
111
-
112
-
113
-
114
-
115
-
116
-
 117
117 -
 118
118 -
 119
119 -
 120
120 -
 121
121 -
 122
122 -
 123
123 -
 124
124 -
 125
125 -
 126
126 -
 127
127 -
 128
128 -
 129
129 -
 130
130 -
 131
131 -
 132
132 -
 133
133 -
 134
134 -
 135
135 -
 136
136 -
 137
137 -
138
-
139
-
140
-
141
-
142
-
143
-
144
-
145
-
146
-
147
-
148
-
149
-
150
-
151
-
152
-
153
-
154
-
155
-
156
-
157
-
158
-
159
-
160
-
161
-
162
-
163
-
164
-
165
-
166
-
167
-
168
 |
 |

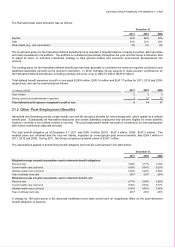
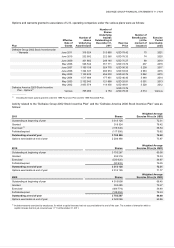
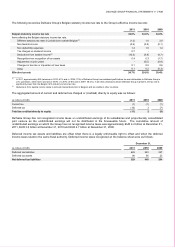
DELHAIZE GROUP FINANCIAL STATEMENTS ’11 // 125
(in millions of EUR)
2011 2010 2009
United
States
Plans
Plans
Outside
of the
United
States Total
United
States
Plans
Plans
Outside
of the
United
States Total
United
States
Plans
Plans
Outside
of the
United
States Total
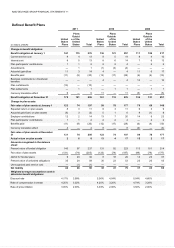
Component of pension cost:
Amounts recognized in the income
statement:
Current service cost
9
4
13
9
5
14
8
4
12
Interest cost
8
5
13
8
6
14
7
6
13
Expected return on plan assets
(8)
(3)
(11)
(8)
(3)
(11)
(6)
(3)
(9)
Amortization of past service cost
—
—
—
(1)
(3)
(4)
—
—
—
Curtailment gain recognized
(10)
—
(10)
—
—
—
—
—
—
Settlement loss recognized
—
1
1
—
1
1
—
1
1
Total pension cost recognized in the
income statement (1) 7 6 8 6 14 9 8 17
Amounts recognized in OCI:
Actuarial (gains)/losses immediately
recognized 17 — 17 (1) (1) (2) 2 7 9
Effect of changes in exchange rates
3
—
3
3
—
3
1
—
1
Cumulative amount of actuarial
gains and losses recognized
53
11
64
33
11
44
31
12
43
Weighted average assumptions used
to determine pension cost:
Discount rate 5.00%
4.54% 5.54% 4.66% 6.01% 5.55%
Expected long-term rate of return on
plan assets during year 6.99% 4.00% 7.75% 4.00% 7.75% 4.40%
Rate of compensation increase 4.25% 3.20% 4.74% 3.29% 4.67% 3.38%
Rate of price inflation 3.03% 2.00% 3.50% 2.00% 3.50% 2.09%
(in millions of EUR)
2011 2010 2009
United
States
Plans
Plans
Outside
of the
United
States Total
United
States
Plans
Plans
Outside
of the
United
States Total
United
States
Plans
Plans
Outside
of the
United
States Total
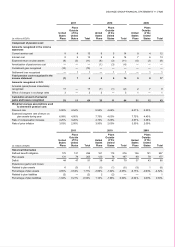
Historical Information
Defined benefit obligation
175
121
296
161
115
276
136
121
257
Plan assets
131
74
205
123
74
197
99
78
177
Deficit
44
47
91
38
41
79
37
43
80
Experience (gains) and losses:
Related to plan assets
6
(3)
3
(5)
(1)
(6)
(9)
1
(8)
Percentage of plan assets
4.65%
-3.54%
1.71%
-3.89%
-1.02%
-3.05%
-9.15%
-0.93%
-4.52%
Related to plan liabilities
(2)
—
(2)
2
(2)
— — 1
1
Percentage of plan liabilities
-1.02%
0.21%
-0.53%
1.14%
-1.96%
0.00%
-0.04%
0.49%
0.39%