Food Lion 2011 Annual Report Download - page 152
Download and view the complete annual report
Please find page 152 of the 2011 Food Lion annual report below. You can navigate through the pages in the report by either clicking on the pages listed below, or by using the keyword search tool below to find specific information within the annual report.-
 1
1 -
2
-
3
-
4
-
5
-
6
-
7
-
8
-
9
-
10
-
11
-
12
-
13
-
14
-
15
-
16
-
17
-
18
-
19
-
20
-
21
-
22
-
23
-
24
-
25
-
26
-
27
-
28
-
29
-
30
-
31
-
32
-
33
-
34
-
35
-
36
-
37
-
38
-
39
-
40
-
41
-
42
-
43
-
44
-
45
-
46
-
47
-
48
-
49
-
50
-
51
-
52
-
53
-
54
-
55
-
56
-
57
-
58
-
59
-
60
-
61
-
62
-
63
-
64
-
65
-
66
-
67
-
68
-
69
-
70
-
71
-
72
-
73
-
74
-
75
-
76
-
77
-
78
-
79
-
80
-
81
-
82
-
83
-
84
-
85
-
86
-
87
-
88
-
89
-
90
-
91
-
92
-
93
-
94
-
95
-
96
-
97
-
98
-
99
-
100
-
101
-
102
-
103
-
104
-
105
-
106
-
107
-
108
-
109
-
110
-
111
-
112
-
113
-
114
-
115
-
116
-
117
-
118
-
119
-
120
-
121
-
122
-
123
-
124
-
125
-
126
-
127
-
128
-
129
-
130
-
131
-
132
-
133
-
134
-
135
-
136
-
137
-
138
-
139
-
140
-
141
-
 142
142 -
 143
143 -
 144
144 -
 145
145 -
 146
146 -
 147
147 -
 148
148 -
 149
149 -
 150
150 -
 151
151 -
 152
152 -
 153
153 -
 154
154 -
 155
155 -
 156
156 -
 157
157 -
 158
158 -
 159
159 -
 160
160 -
 161
161 -
 162
162 -
163
-
164
-
165
-
166
-
167
-
168
 |
 |

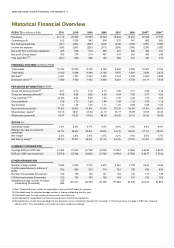
150 // DELHAIZE GROUP FINANCIAL STATEMENTS ’11
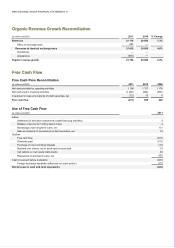
Organic Revenue Growth Reconciliation
(in millions of EUR) 2011 2010 % Change
Revenues 21 119 20 850 1.3%
Effect of exchange rates 693 —
Revenues at identical exchange rates 21 812 20 850 4.6%
Divestitures — —
Acquisitions (458) —
Organic revenue growth 21 354 20 850 2.4%
Free Cash Flow
Free Cash Flow Reconciliation
(in millions of EUR) 2011 2010 2009
Net cash provided by operating activities 1 106 1 317 1 176
Net cash used in investing activities (1 265) (665) (555)
Investment in (sale and maturity of) debt securities, net (72) 13 5
Free cash flow (231) 665 626
Use of Free Cash Flow
(in millions of EUR) 2011
Inflow:
Settlement of derivative instruments (under financing activities) 2
Release of escrow for funding senior notes 2
Borrowings under long-term loans, net 131
Sale and maturity of (investment in) debt securities, net 72
Outflow:
Free cash flow (231)
Dividends paid (173)
Purchase of non-controlling interests (10)
Buyback own shares, net of stock options exercised (7)
Call options on own equity instruments (6)
Repayment of short-term loans, net (85)
Cash movement before translation (305)
Foreign exchange translation difference (on cash portion)
(21)
Net decrease in cash and cash equivalents (326)