Food Lion 2011 Annual Report Download - page 28
Download and view the complete annual report
Please find page 28 of the 2011 Food Lion annual report below. You can navigate through the pages in the report by either clicking on the pages listed below, or by using the keyword search tool below to find specific information within the annual report.-
 1
1 -
2
-
3
-
4
-
5
-
6
-
7
-
8
-
9
-
10
-
11
-
12
-
13
-
14
-
15
-
16
-
17
-
 18
18 -
 19
19 -
 20
20 -
 21
21 -
 22
22 -
 23
23 -
 24
24 -
 25
25 -
 26
26 -
 27
27 -
 28
28 -
 29
29 -
 30
30 -
 31
31 -
 32
32 -
 33
33 -
 34
34 -
 35
35 -
 36
36 -
 37
37 -
 38
38 -
39
-
40
-
41
-
42
-
43
-
44
-
45
-
46
-
47
-
48
-
49
-
50
-
51
-
52
-
53
-
54
-
55
-
56
-
57
-
58
-
59
-
60
-
61
-
62
-
63
-
64
-
65
-
66
-
67
-
68
-
69
-
70
-
71
-
72
-
73
-
74
-
75
-
76
-
77
-
78
-
79
-
80
-
81
-
82
-
83
-
84
-
85
-
86
-
87
-
88
-
89
-
90
-
91
-
92
-
93
-
94
-
95
-
96
-
97
-
98
-
99
-
100
-
101
-
102
-
103
-
104
-
105
-
106
-
107
-
108
-
109
-
110
-
111
-
112
-
113
-
114
-
115
-
116
-
117
-
118
-
119
-
120
-
121
-
122
-
123
-
124
-
125
-
126
-
127
-
128
-
129
-
130
-
131
-
132
-
133
-
134
-
135
-
136
-
137
-
138
-
139
-
140
-
141
-
142
-
143
-
144
-
145
-
146
-
147
-
148
-
149
-
150
-
151
-
152
-
153
-
154
-
155
-
156
-
157
-
158
-
159
-
160
-
161
-
162
-
163
-
164
-
165
-
166
-
167
-
168
 |
 |
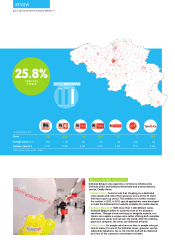
At the end of 2011, total equity had increased
by 7.1% to EUR 5.4 billion as a result of the
net profit and the non-controlling interests
related to the acquisition of Maxi, partly off-
set by the Group’s payment of dividends. The
number of Delhaize Group shares, includ-
ing treasury shares, increased in 2011 by
336 909 newly issued shares to 102 million.
Delhaize Group owned 1 183 948 treasury
shares at the end of 2011.
At the end of 2011, Delhaize Group’s net debt
increased by EUR 860 million (at actual rates) to
EUR 2 647 million mainly as a result of negative
free cash flow, the inclusion of Delta Maxi exist-
ing debt and the dividend payment.
At the end of 2011, Delhaize Group had total
annual minimum operating lease commit-
ments for 2012 of EUR 317 million, includ-
ing EUR 12 million related to closed stores.
These leases generally have terms that range
between 1 and 40 years with renewal options
ranging from 3 to 36 years.
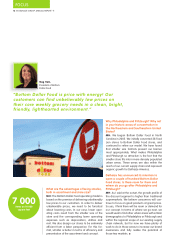
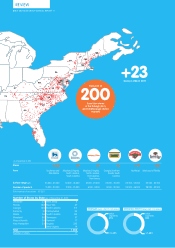
Events after Balance Sheet Date
On January 12, 2012, Delhaize Group
announced, following a thorough portfolio
review of its stores, the decision to close one
distribution center and 146 stores across its
network: 126 stores in the U.S. (113 Food Lion,
7 Bloom and 6 Bottom Dollar Food) and 20
underperforming Maxi stores (in Serbia, Bul-
garia and Bosnia and Herzegovina), and to
abandon several of its investment properties.
As a result, the Group recorded an impairment
charge of USD 177 million (EUR 127 million) in
the fourth quarter of 2011 (see also above). This
charge solely relates to the U.S. operations as
the underperformance of the stores in South-
eastern Europe was already reflected in the
fair values of the related assets recorded in the
opening balance sheet.
Beginning the first quarter of 2012, the Group
expects earnings to be impacted by approxi-
mately EUR 200 million (approximately
USD 235 million for the U.S. and EUR 30 million
for Southeastern Europe) to reflect store closing
liabilities including a reserve for ongoing lease
and severance obligations, accelerated depre-
ciation related to store conversions, conversion
costs, inventory write-downs and sales price
mark downs. This will have an after tax impact
of approximately EUR 125 million on the 2012
earnings.
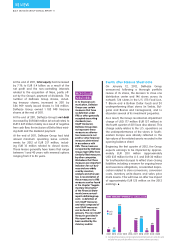
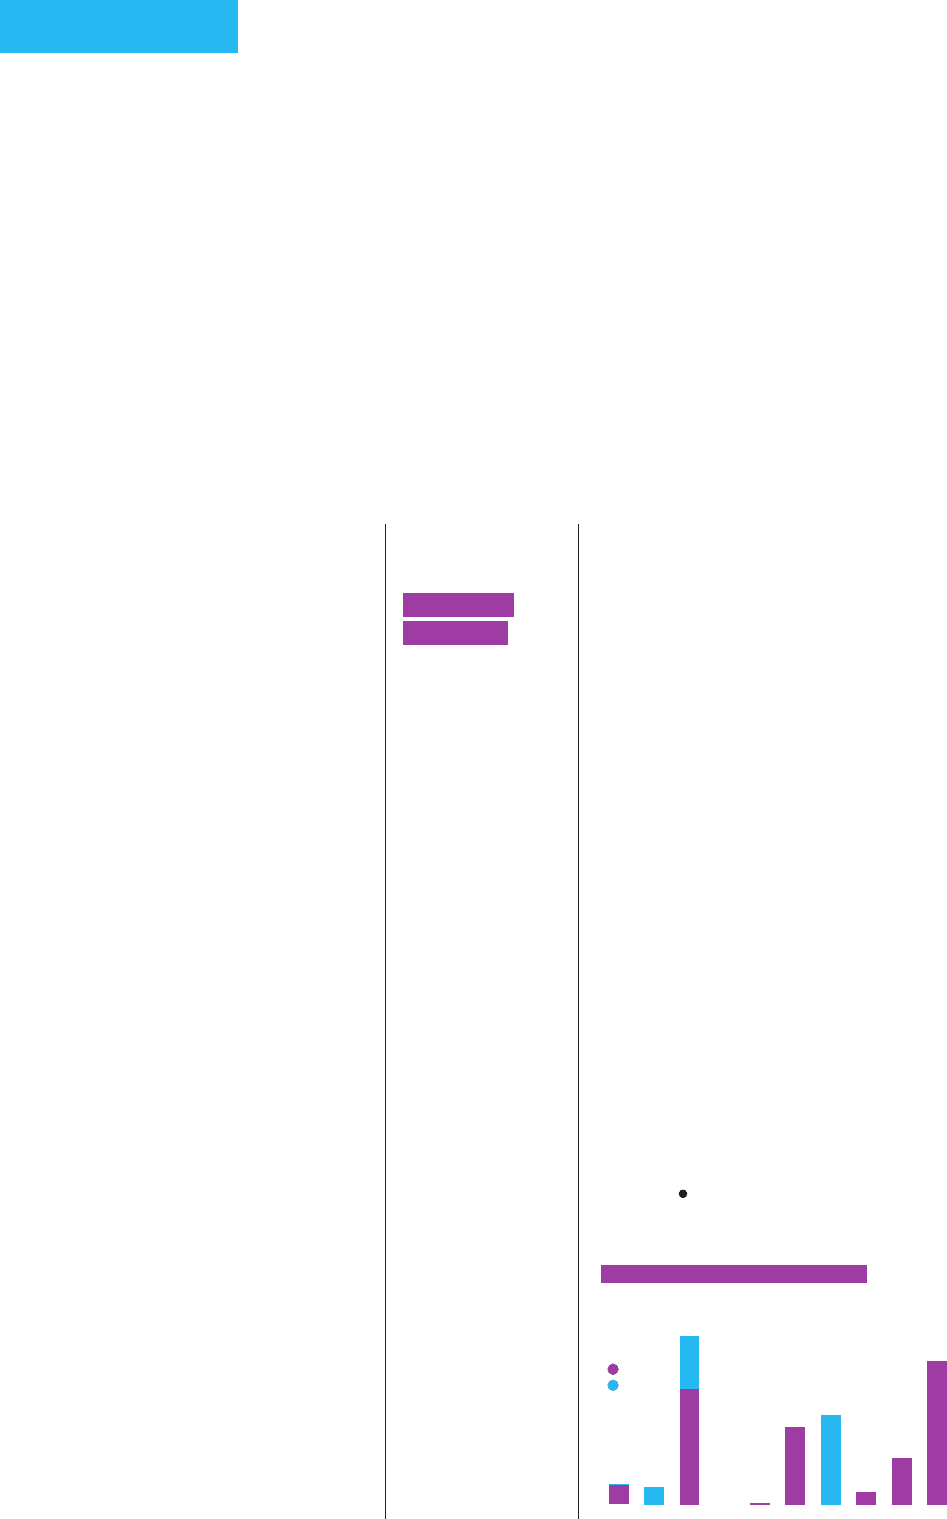
DEBT MATURITY PROFILE(1) (in millions of EUR)
2012 2013 2014 2015 2016 2017 2018 2027 2031 2040
USD
EUR
80
237
518
7
348
400
55
215
639
87
1
(1) Excluding finance leases; principal payments (related premiums and discounts
not taken into account) after effect of cross-currency interest rate swaps.
NON-GAAP
MEASURES
In its financial com-
munication, Delhaize
Group uses certain
measures that have
no definition under
IFRS or other generally
accepted accounting
standards (non-
GAAP measures).
Delhaize Group does
not represent these
measures as alterna-
tive measures to net
profit or other financial
measures determined
in accordance with
IFRS. These measures
as reported by Delhaize
Group might differ from
similarly titled measures
by other companies.
We believe that these
measures are important
indicators for our busi-
ness and are widely
used by investors,
analysts and other par-
ties. A reconciliation of
these measures to IFRS
measures can be found
in the chapter “Supple-
mentary Information”
of the Financial State-
ments (www.annual-
reports.delhaizegroup.
com). A definition of
non-GAAP measures
and ratio composed of
non-GAAP measures
can be found in the
glossary. The non-GAAP
measures provided in
this report have not
been audited by the
statutory auditor.
REVIEW
26 // DELHAIZE GROUP ANNUAL REPORT ‘11